
3D Charts

We’ve been hard at work creating new 3D, interactive visualizations within VTK using the Charts API.
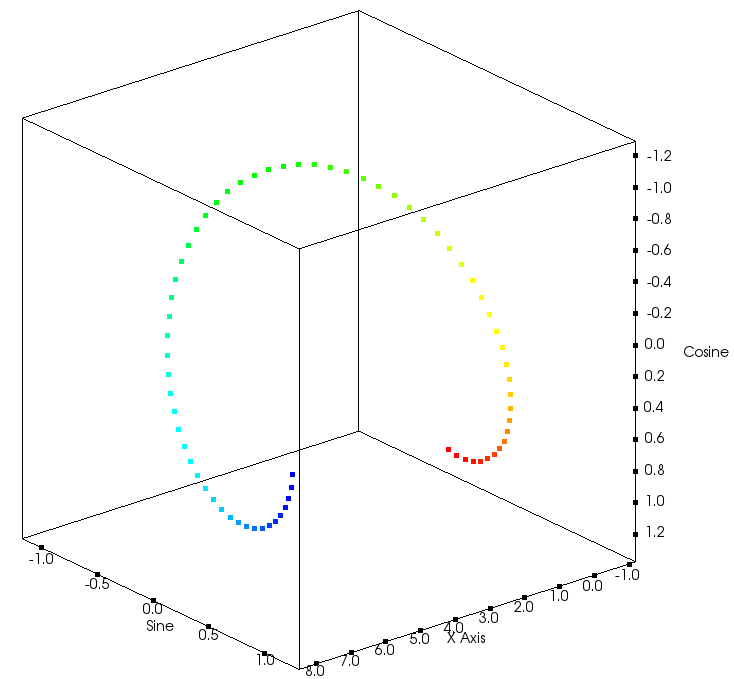
The first visualization we created is an interactive 3D scatter plot. This new class allows us to visualize data in four dimensions: X, Y, Z, and color. The input to this class is a table. The user specifies which columns of the table should correspond to each of the four dimensions. It currently supports the typical “trackball” interactions: panning, zooming, and rotating, as well as snapping to any pair of 2D axes. The data is automatically clipped as it moves outside the boundaries of the cube axes. This allows you to focus in on a subset of your data. A nice feature of these interactions is that the data and axes are handled separately. So if you zoom in on the data, your axes don’t suddenly disappear off the screen. This is also true for panning.
If you’re interested in using the 3D scatter plot, I suggest you take a look at the following test case: Charts/Core/Testing/Cxx/TestInteractiveChartXYZ.cxx
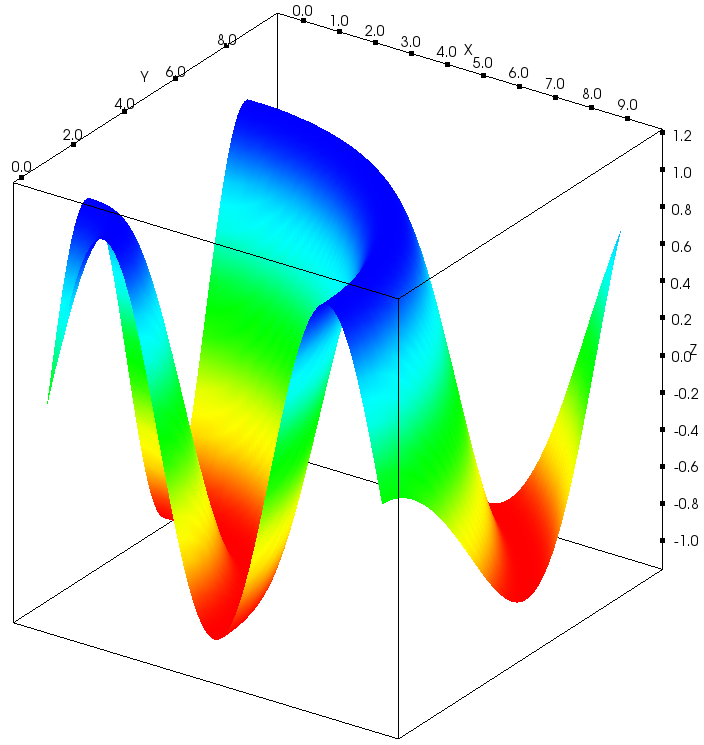
We also extended VTK’s Charts API to support a 3D surface plot. Like the 3D scatter plot, the input to this visualization is a vtkTable. The layout of this table is a bit different, though. Each cell in the table represents a height (Z) value in the 3D surface. Currently the surface is colored by height, although we may add support for color as an independent dimension in the future.
Otherwise, this class is similar to the 3D scatter plot that we’ve already described. It supports all the same interactions and clipping as the 3D scatter plot. Data and axes are also handled separately for the purposes of zooming and panning.
The test for this visualization is located at Charts/Core/Testing/Cxx/TestSurfacePlot.cxx .
Is there a tcl implementation for this ?
how to get/set the labels X, Y, Z of the 3D chart ?
Take a look at the test of this class for an example of how to set the axes labels for a 3D chart.
https://gitlab.kitware.com/vtk/vtk/blob/master/Charts/Core/Testing/Cxx/TestInteractiveChartXYZ.cxx
Is there a way to get the x,y,z values of individual points? A tooltip like 2d plots would be ideal. Also is there a way to zoom into any part of the space instead of just the center?
Could you talk more on the layout of the table for the surface plot? for example, how would I plot a square?
Please fix below functions.
//—————————————————————————–
float vtkPlotSurface::ColumnToX(int columnIndex)
{
float newRange = this->XMaximum – this->XMinimum;
return static_cast(columnIndex) * (newRange / (this->NumberOfColumns – 1)) + this->XMinimum;
}
//—————————————————————————–
float vtkPlotSurface::RowToY(int rowIndex)
{
float newRange = this->YMaximum – this->YMinimum;
return static_cast(rowIndex) * (newRange / (this->NumberOfRows – 1)) + this->YMinimum;
}
Please open an issue on our gitlab : https://gitlab.kitware.com/vtk/vtk/-/issues/