
A new Embossing Representations Plugin for ParaView
Context
Besides being large, climate simulations are usually comprised of many different variables and quantities that often need to be visualized side by side. The two new representations included in this plugin have been explicitly developed with this idea in mind, and as climate simulations tend to be based on all kind of different grids, special attention was paid that all major ones are supported. Both representations have been tested with rectilinear grids, tri-polar curvilinear grids, as well as semi-irregular grids such as ICON and MPAS.
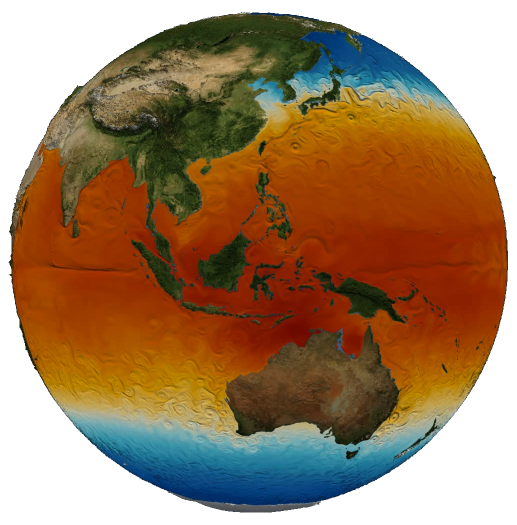
An example that visualizes data from a high-resolution ICON ocean simulation can be seen in Video 1. This example visualizes over time the variable ocean surface temperature as a regular surface, while the ocean currents are additionally highlighted using a bump shading derived from the magnitude of the horizontal velocity field. Both, the beauty as well as the complexity of the oceans are well depicted within this animation.
Video 1: Ocean surface temperature that is bump shaded by horizontal velocity.
Data & video credit: DKRZ.
Another example for a multivariate data visualization can be seen in Video 2. This one uses rectilinear data produced by climate projections carried out with MPI-ESM within the CMIP5 project and the 5th IPCC assessment report. It shows in color the changes in precipitation in percent for the end of this century compared to the time from 1986 – 2005. The monthly average precipitation for the period from 1986 to 2005 is additionally displayed using the new extrusion mapper. A dangerous consequence of climate change becomes evident in many regions, where small bars are turning red, meaning the little precipitation existing today will be dramatically reduced in a warmer world.
Video 2: Changes in precipitation with extrusion map of monthly average precipitation.
Data & video credit: DKRZ.
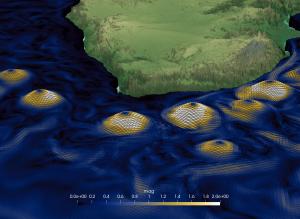
Figure 1: Horizontal velocity magnitude of the ocean, extruded by sear surface height.
Data & picture credit: DKRZ.
How to use
The new representations called “Bump Mapped Surface” and “Extrusion surface” can be selected in the representation combo box when the plugin is loaded. They extend the classic “Surface” representation without doing any extra computations on the CPU. In both representations, all the work is handled by the GPU using GLSL shaders.
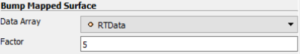
The “Bump Mapped Surface” representation works only with point data and does not modify at all the current geometry. It uses the gradient of the data to alter surface normals and creates a shade effect. When selected, the data array and a factor can be chosen in the properties panel.
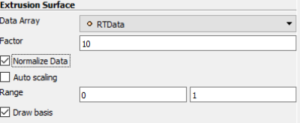
The “Extrusion surface” is designed to work with cell data and behaves like a histogram. The cells are extruded based on their value in the selected array and a factor in the properties panel. Optionally, it is possible to normalize values with an auto-scaling based on the range of the data or a manual range.
Note that data parallelism has been taken into account and both representations work in builtin mode or client/server mode with a serial or a MPI parallel server.
The new EmbossingRepresentations plugin is now available in ParaView master branch and will be available in next release to come (v5.5).
This work was supported by the German Climate Computing Center (DKRZ).

Developments were done by Kitware SAS, France.
 | Michael Migliore is an R&D Engineer at Kitware, France. He is a developer of VTK and ParaView since 2017. His areas of expertise include computer graphics, physics simulation, collision detection and software development. |
 | Joachim Pouderoux is a Technical Expert at Kitware, France. He is a developer of VTK and ParaView since 2012. His areas of expertise include scientific visualization, computer graphics, interaction techniques, Voronoi meshing and software development. |
Figures 1 & 2 are missing.
Very nice videos. Would like to follow up sometime soon.