
Bringing back Cube Axes (sort of)
When we added Axes Grid to ParaView, it was intended to replace a previous implementation of axes annotation called Cube Axes. While the Axes Grid is much superior to the Cube Axes in appearance and functionality, due to a implementation nuance, the Axes Grid only supported showing the grid around all datasets visible in the view. Unlike Cube Axes, which allowed use to show axes for datasets for their choosing.
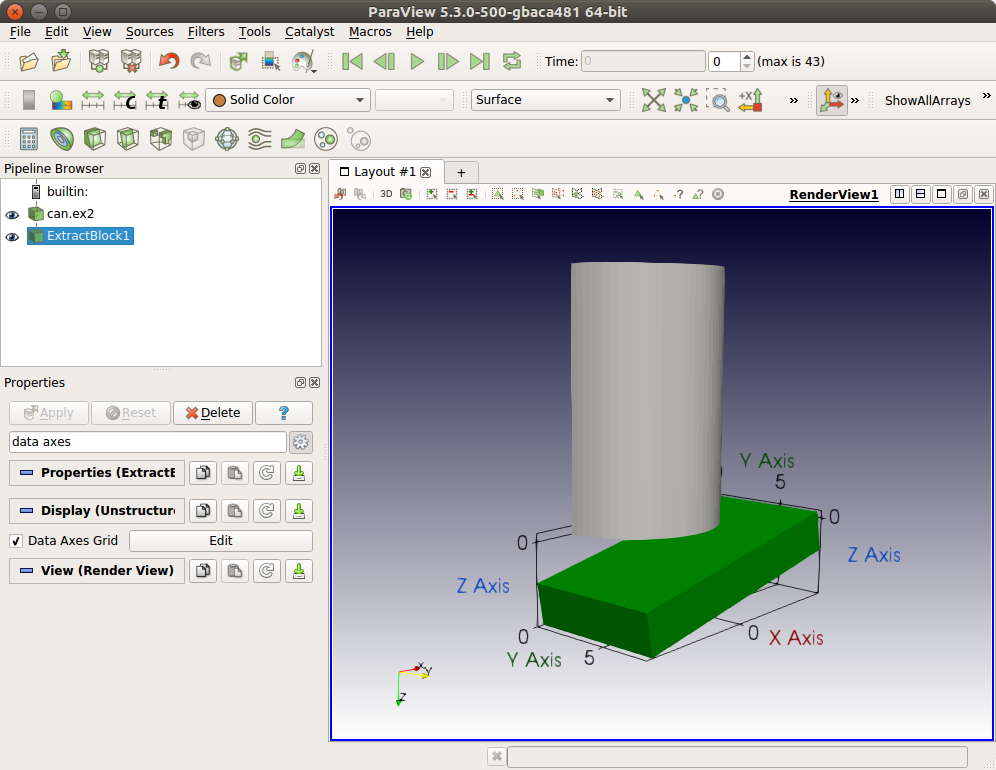
With upcoming release of ParaView, we’re fixing this shortcoming. With ParaView 5.4, you now have access to what we’re calling Data Axes Grid, accessible from the Properties panel.
When checked, ParaView will render an axes annotation for the active dataset using its bounds. Everything else is identical the Axes Grid, including options available and Python support. Here’s a snippet to show Data Axes Grid for a source in Python.
renderView1 = GetActiveView()
source = GetActiveSource()
displayProperties = GetDisplayProperties(source, view=renderView1)

# Show Data Axes Grid.
displayProperties.DataAxesGrid.GridAxesVisibility = 1
You can always use Python tracing functionality in ParaView to discover other options available.