ClimatePipes: User-Friendly Data Access, Data Manipulation, Data Analysis and Visualization of Community Climate Models – Part I: Visualization of archived climate data

Introduction
This is the first in series of articles that will discuss the work performed as part of the DOE ClimatePipes project. In this article, we introduce ClimatePipes and describe one of the three applications, which enables the visualization of climate datasets from the Earth System Grid Federation (ESGF, http://esgf.org).
Motivation
Observations unequivocally show that the global climate is changing, caused over the past 50 years primarily by human-induced emissions of heat-trapping gases. The dramatic effects of climate change include increases in water temperature, reduced frost days, a rise in sea level, and reduced snow cover. As the pace of climate change is expected to accelerate, the impact of these changes will resonate through a broad range of fields including public health, infrastructure, water resources, and many others.
Long-term coordinated planning, funding, and action are required to reduce the impact on ecosystems, infrastructure, economies, and the global population. The wide variety of fields that climate change influences means access to climate data and resources can no longer be restricted to scientists and researchers; other stakeholders must be involved.
Unfortunately, widespread use of climate data in non-climate science communities is impeded by factors such as large data size, lack of adequate metadata, poor documentation, and lack of sufficient computational and visualization resources.
ClimatePipes addresses many of these challenges by creating a platform that provides state-of-the-art, user-friendly data access, analysis, and visualization for climate and other relevant geospatial datasets, thus making the climate simulation data available to non-researchers, decision-makers, and other stakeholders. The overarching goals of ClimatePipes are:
-
To enable users to explore real-world questions related to climate change.
-
Provide tools for data access, analysis, and visualization.
-
Facilitate collaboration by enabling users to share datasets, workflows, and visualization.
ClimatePipes: Archive Application
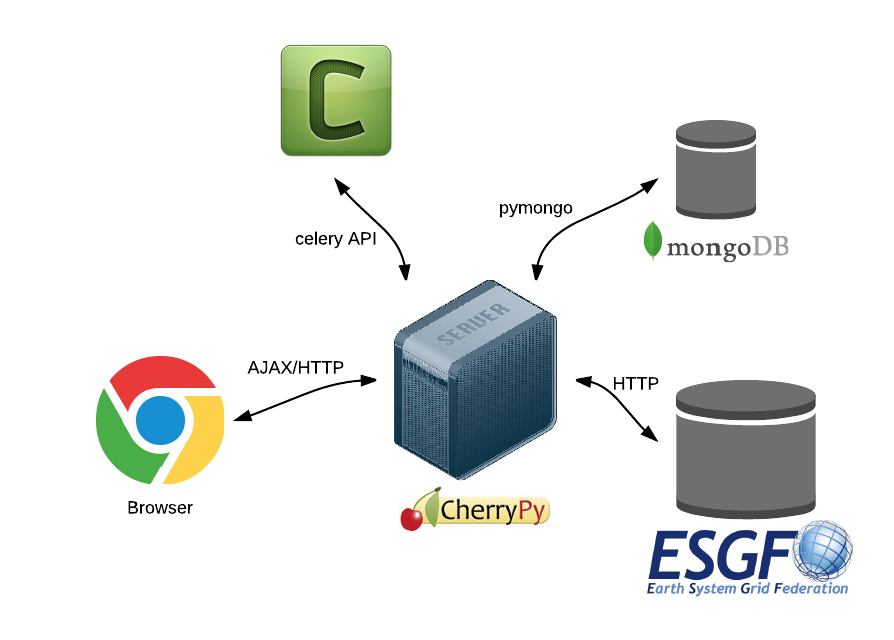
Figure 1: Architecture overview – key components.
Data integration with ESGF
ESGF is a distributed data archive to host climate datasets and associated metadata information. We have integrated with ESGF by providing a query interface to enable searching of climate datasets in ESGF using a RESTful search API. The search is performed by the ClimatePipes backend. The result set returned by the ESGF can potentially be very large and the total search time can be significant. A streaming approach is used to maintain the interactivity and thus avoid the user having the wait for the entire search to be completed. The XML document that contains the search result from ESGF is parsed and as each catalog is received, the result is streamed up to the client so the user sees the first documents very quickly. The user can then interact with this data as the rest streams in.
Data processing for visualization and analysis
The vast majority of climate datasets on ESGF are in NetCDF CF convention format file. We uses a static VTK pipeline that begins with a vtkNetCDFCFReader source. The reader opens and parses a given file and produces VTK data structures corresponding to a chosen time step and variable selection. The rest of the pipeline contains filters that prepare the data for transmission to the client. To deliver data to the client, we chose the simple and well-known GeoJSON format (http://www.geojson.org/geojson-spec.html). We developed a server side VTK side writer and a client side JavaScript GeoJSON importer. On the server side, the new vtkGeoJSON writer instance sits at the end of the VTK pipeline and converts vtkPolyData into an in memory GeoJSON representation suitable for delivery over the network. On the client side, a geojsonReader instance is created in response to a JQuery request to the server for a particular data file. The reader parses the data stream so that it may be visualized and otherwise processed on the client.
The client side rendering is performed using GeoJS, a JavaScript Geo visualization library developed for ClimatePipes based on WebGL
Using the application
The application can be accessed at https://climatepipes.kitware.com/apps/archive/
Register
In order to protect the ESGF datasets we are working with, the users of the application need an ESGF account to login to the application. You can register for one here: https://pcmdi9.llnl.gov/esgf-web-fe/createAccount
Login
Authentication is performed using ESGF credentials. The pull openid URL should be provided when logging into the application.
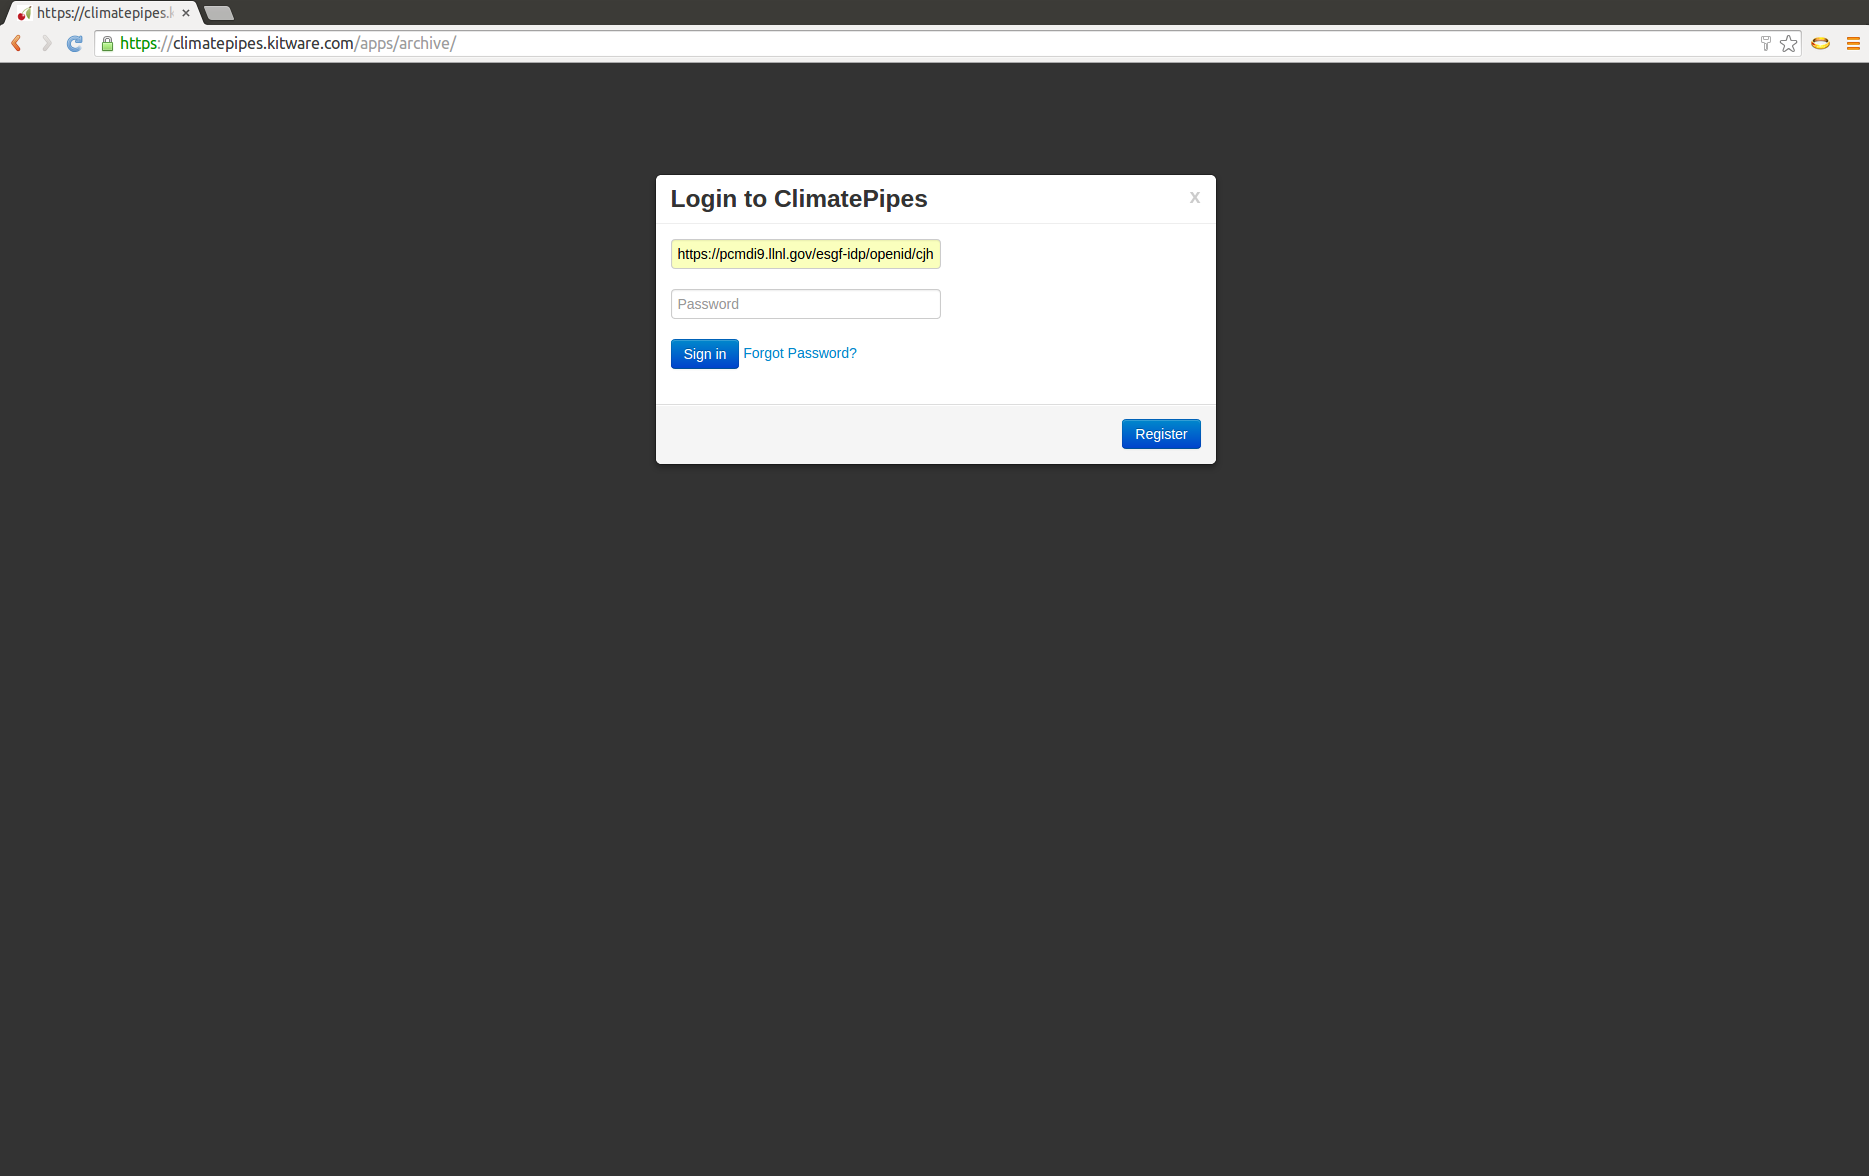
Figure 2: Archive login page
Search
Search for datasets based on keywords, temporal range and spatial area is supported. This information is used to search the ESGF index using a simple RESTful API.
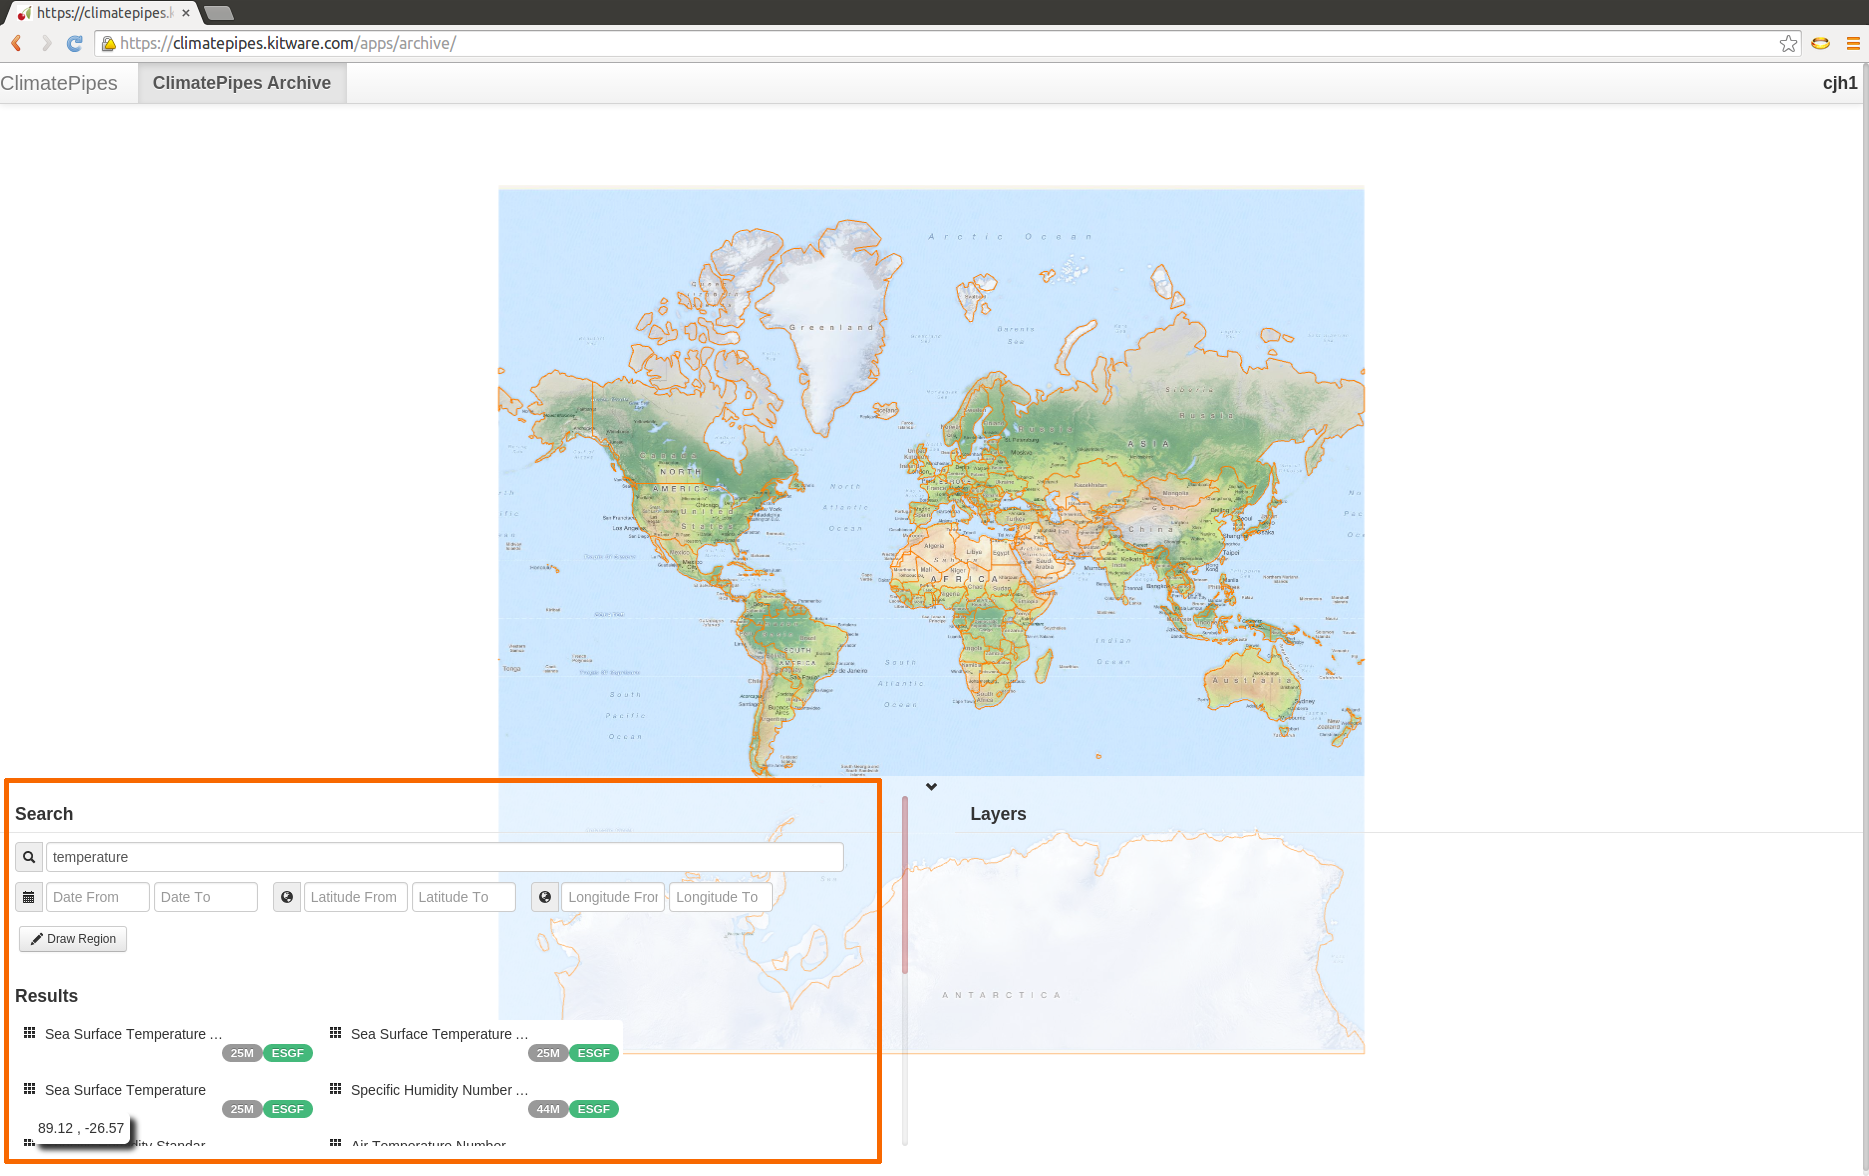
Figure 3: Simple GIS interface showing query results
Download
Datasets appearing in the search results can be selected and dragged onto the map. Datasets not already downloaded will be set to download. This download operation is performed in the background as a Celery task to avoid tying up a request thread. The progress of the download is updated in the UI as it progresses.
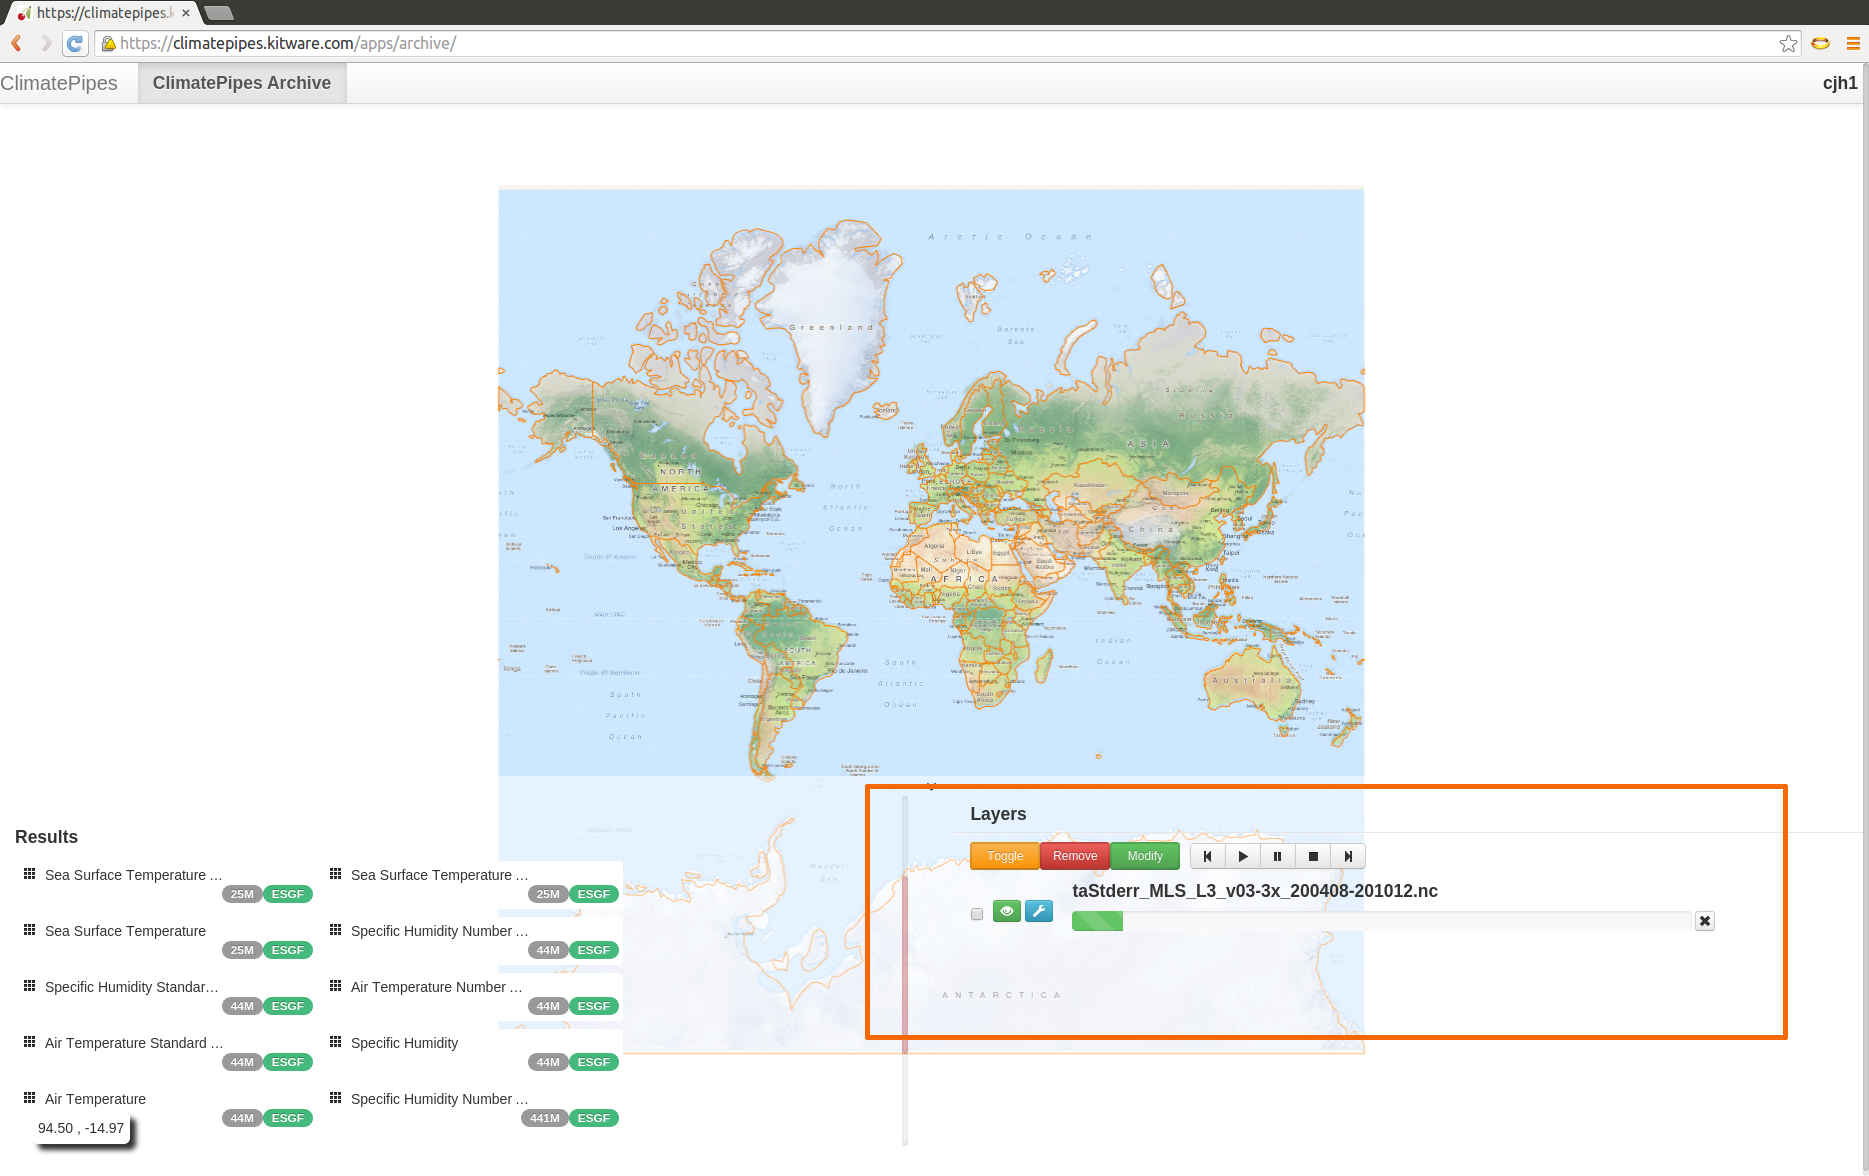
Figure 4: Asynchronous downloading of the data using Celery
When the dataset download is complete you will be asked to select an algorithm to use to process the dataset before visualization
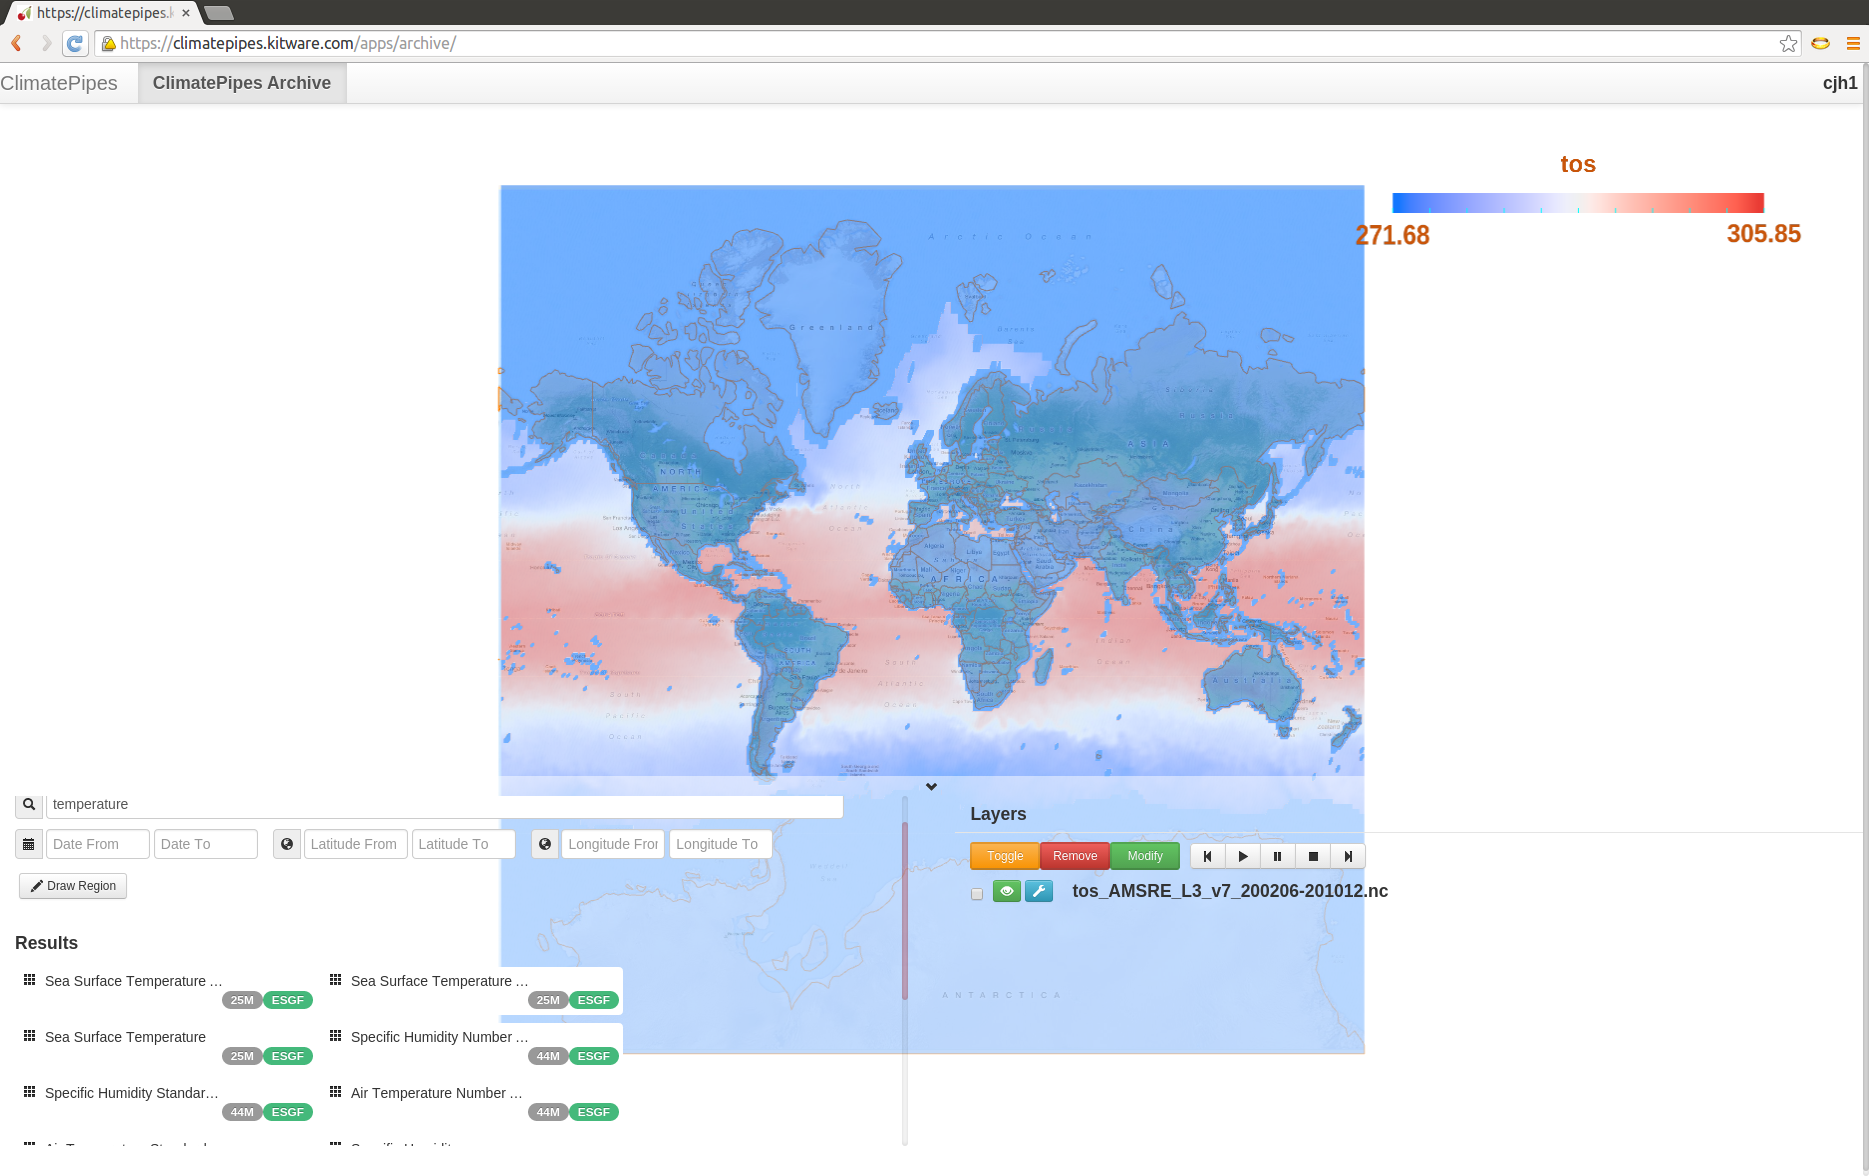
Figure 5: Visualization of the climate data over the map using GeoJS
Interact
Once a dataset has been visualized you can interact with the map and the layers using the following option:
-
Zoom – Right click drag.
-
Pan – Left click drap.
-
Toggle – Multple datasets can be added to the base map; these can be toggled on and off.
-
Animation – Datasets that have temporal data can be animated using the animation controls.
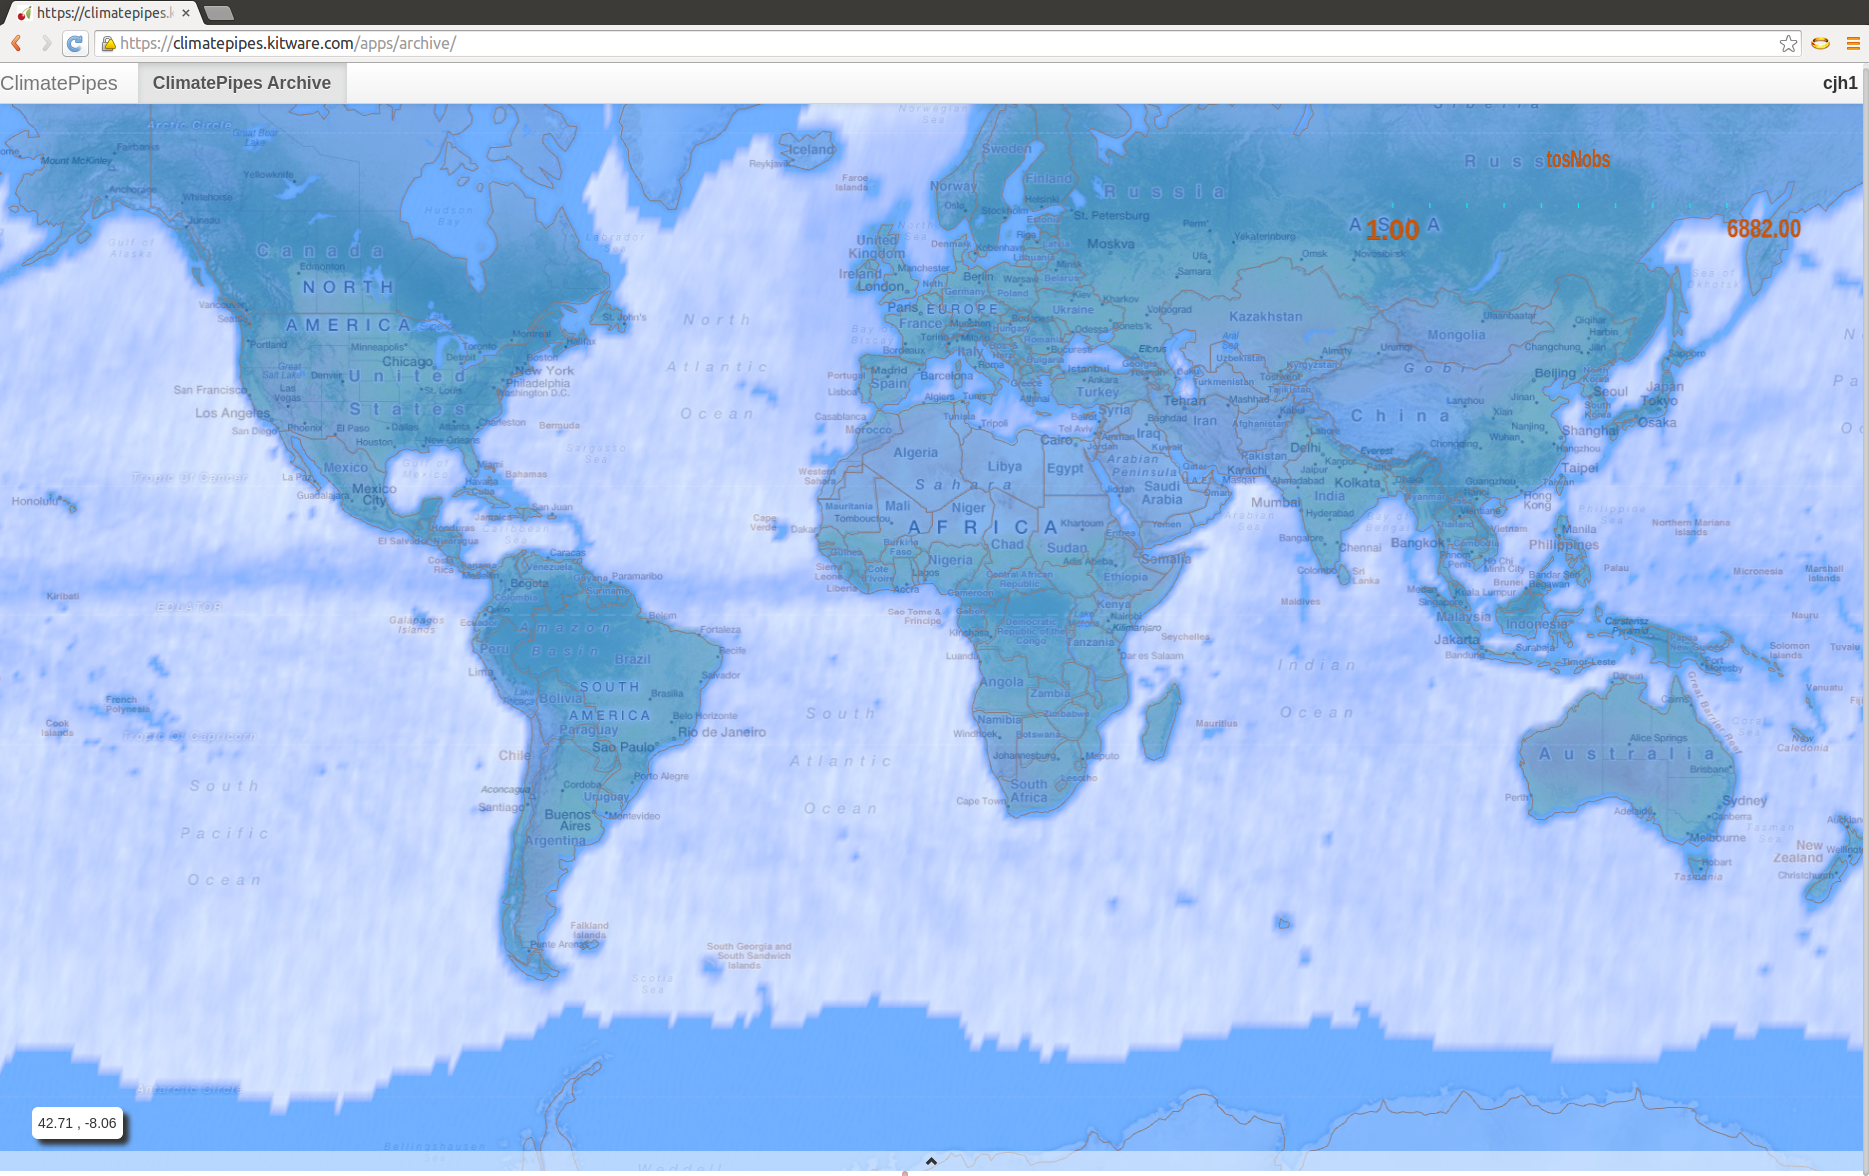
Figure 6: Another climate data visualization
Final words
The archive application is the very first web-application we have developed as part of the ClimatePipes project. Since then we have improved various aspects of visualization. We will talk about those in the next article in the series.
The work is performed under DOE SBIR Phase II ( DE-SC0006493 ). The team consists of researchers and developers from Kitware and New York University (NYU). We are thankful to LLNL, NASA, and ORNL for their support and help.