
Contour Plots in GeoJS

Recently we have added a new feature to GeoJS: 2D contour plots. For this feature, a user defines an area using a squarely-connected grid. The grid can be regular or irregular. The colors can be stepped or smooth, and the scalar values can be mapped uniformly or in a non-linear manner.
For example, here is a contour plot using the altitude (z value) values of Oahu, Hawaii. The colors are taken from one of the Paraview color maps.
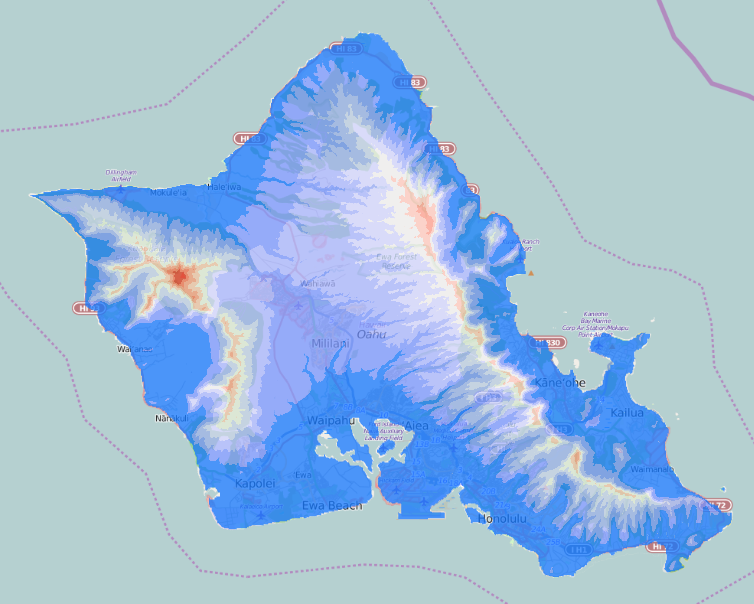
This demo will be on the geojs examples page after the next release. The code for it can be found on GitHub.
There are many options for how the data is specified for the contour and how it is rendered. Although the data must be arranged as a squarely-connected grid, the grid does not have to be even. Each point on the grid can have any latitude and longitude. Alternately, any corner of the grid can be specified along with the distance between rows and columns of the grid. Each grid point can have its own opacity value.
The scalar values used for the contour can be taken from the z value of each point or specified as a separate array. If a value is null, then all of the grid squares that use that point will not be rendered. For the example above, the ocean values were specified as null.
The colors used for the contour can be specified completely with any number of discrete colors, each with its own opacity. Two separate colors can be used for values above or below a specified maximum and minimum (the default is to use the entire range of the scalar value). The mapping between scalar values and colors does not have to be linear — it will be piecewise linear between colors, but the colors can correspond to any monotonic sequence of values.
Here are some variations of plotting the Oahu data:
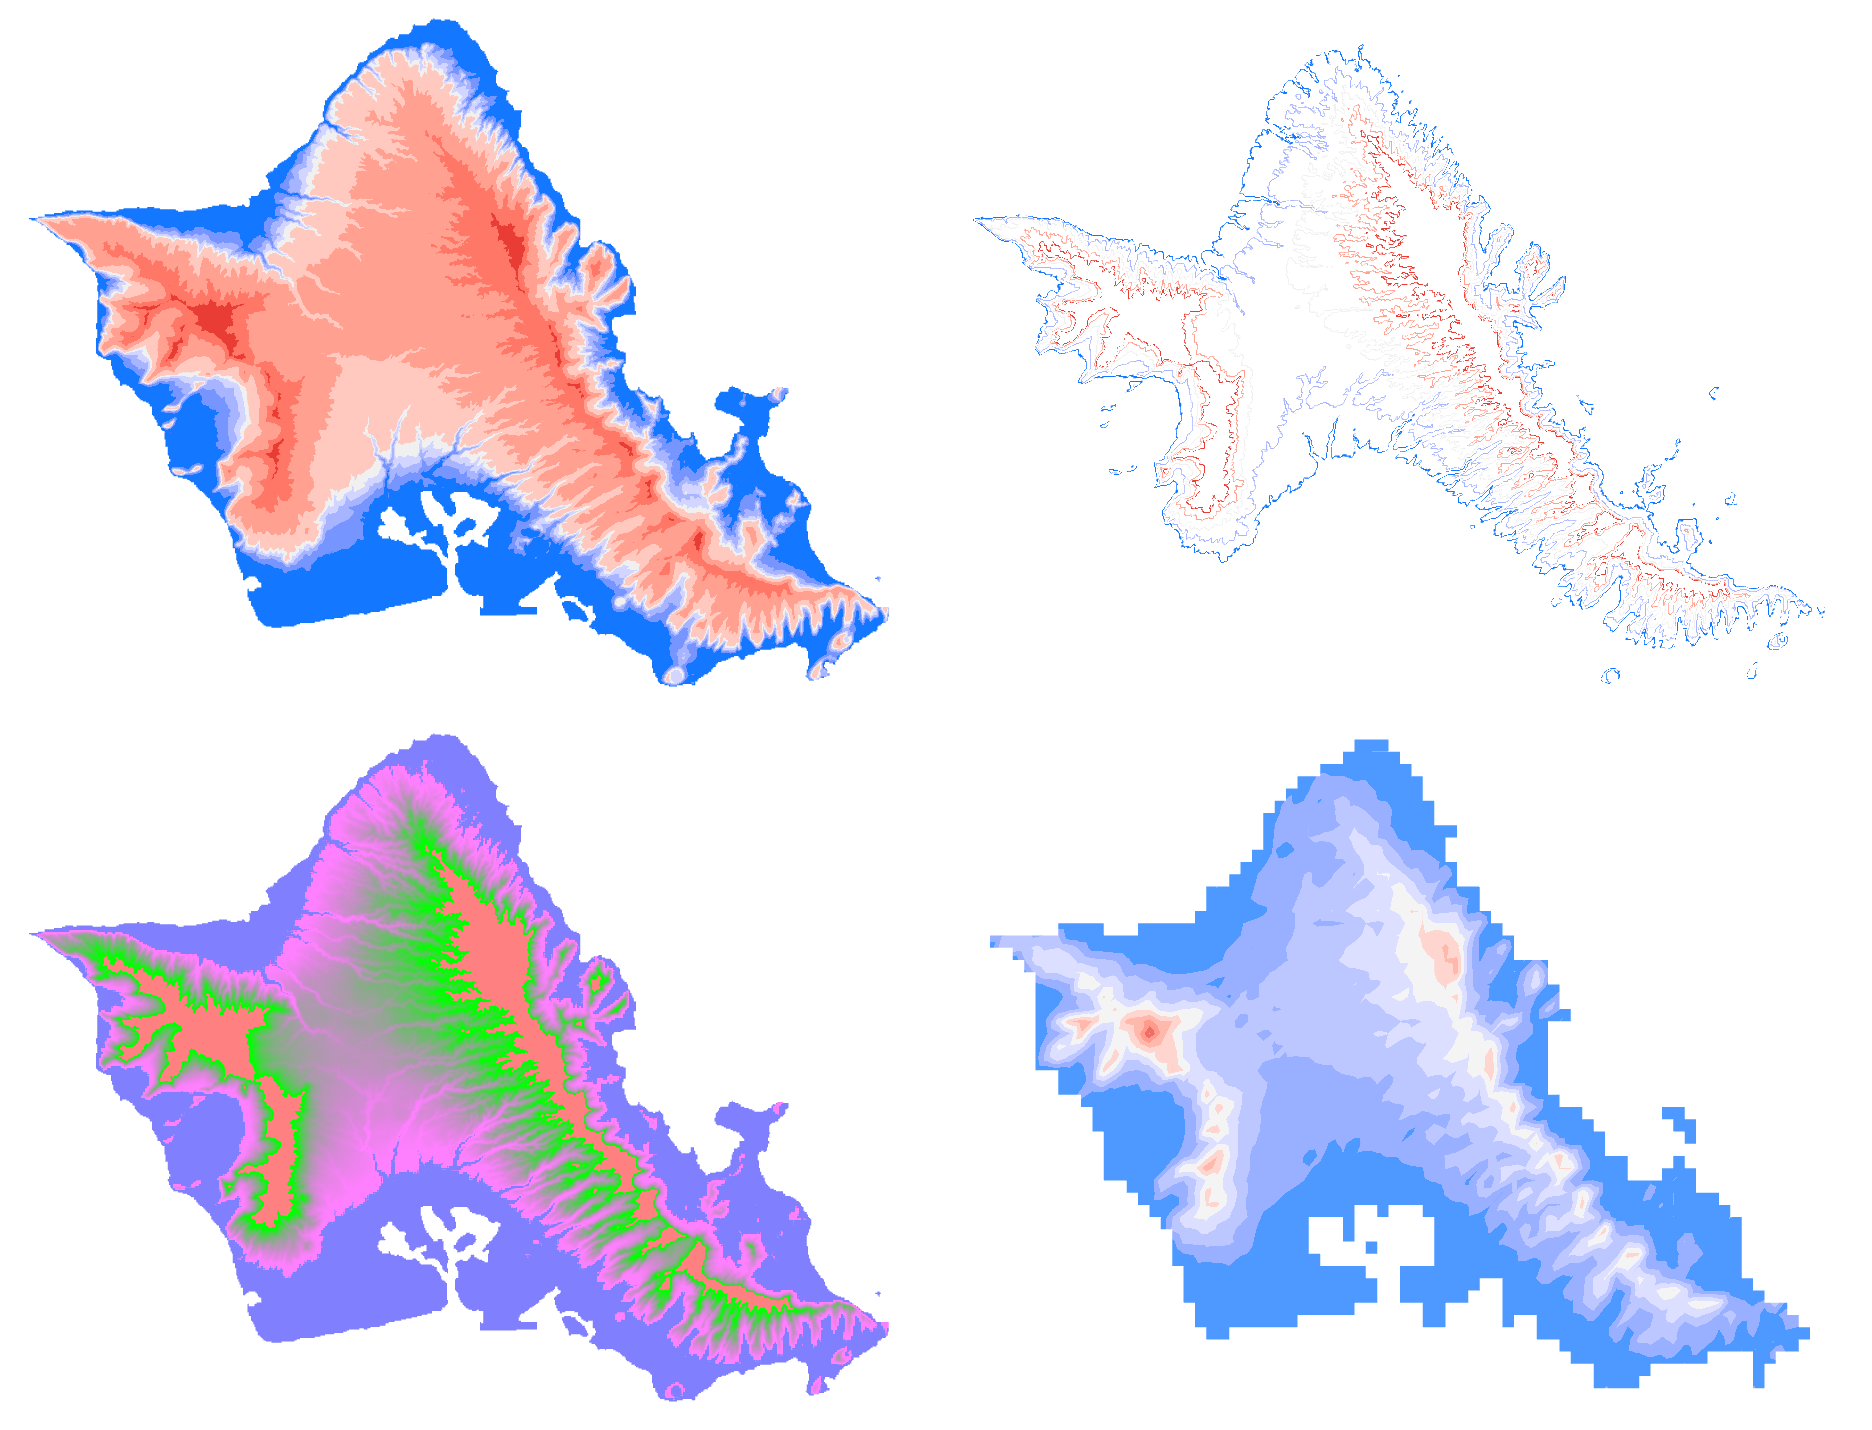
Upper left: a non-linear mapping with more colors used for lower elevations.
Upper right: an approximation of iso contour lines. This is a fast way to generate iso lines, but the line thickness will vary some. Each line can be distinctly colored.
Lower left: the maximum and minimum values are cropped to alternate colors, and the contour is smoothly shaded within that range, rather than using discrete colors.
Lower right: a lower resolution version of the contour.
The maximum size of the contour grid is limited by Graphic Chip / GL driver memory. For a machine that has 1 GB of Graphics memory, you can have up to 8947848 elements (quadrilaterals) in the grid.
GeoJS is an open source geospatial analysis and visualization library hosted on Github. GeoJS focus is to provide traditional GIS capabilities along with other geospatial, scientific, and information visualization features to enable creation of interactive 2D and 3D visualizations over the Web.