
Dendrograms, heatmaps, and more

We have been hard at work adding new information visualizations to VTK. These classes were initially created to support phylogenetics researchers, but they were also developed within VTK’s framework of general purpose Infovis tools. This makes them well-suited to a wide variety of tasks (not just phylogenetics). What follows is a brief introduction to these new VTK classes. If any of them intrigue you, click on the title above the image for more detailed information on how to use them within your own projects.
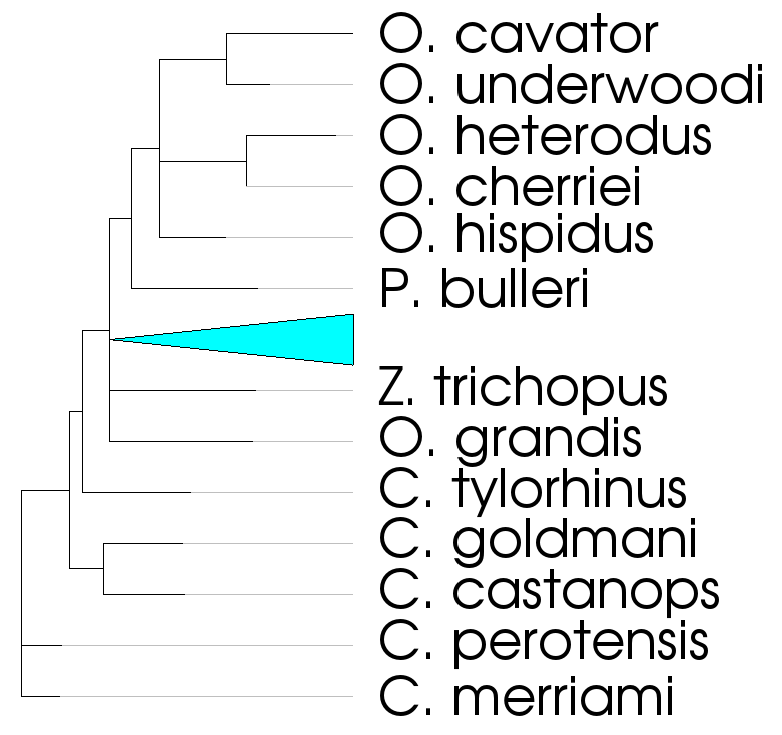
The image above shows vtkDendrogramItem being used to display the evolutionary relationships between certain species of pocket gophers. As you can see, the vtkDendrogramItem provides a new way to visualize a tree using VTK. At first glance, what distinguishes this class from vtkGraphLayoutView is its 90° corners. That’s not all that makes this class different, though. It has a number of other features that make it a state-of-the-art, interactive tree visualization. These include:
- The ability to collapse and expand subtrees by double-clicking on them. The cyan triangle above represents a small collapsed subtree. Collapsed subtrees are colored based on how many leaf nodes they contain, using a cool-to-warm color space. In the above example, the triangle is drawn with a cool color because it contains a small portion of the total tree.
- Pan & zoom interactivity. In addition to the ability to collapse subtrees, this allows you to explore your data and focus on only the parts that currently interest you.
- Automatic font scaling. As you zoom in or out on the dendrogram, the size of the text labels will change correspondingly. If you zoom out so far that the labels would no longer be legible, they disappear instead of appearing as a jumbled mess.
- Rotating the dendrogram by 90° increments. The above example exhibits the default rotation (left-to-right), but the dendrogram can also easily be rendered top-down, bottom-up, or right-to-left.
- Extending leaf nodes so that they line up vertically. As you can see in the image above, portions of the leaf nodes are drawn in a light grey color. This is done so that you can easily determine which text label corresponds to which leaf node without losing information about the true length of these terminal edges. This behavior can be changed by calling the ExtendLeafNodesOn() or ExtendLeafNodesOff() methods of vtkDendrogramItem.
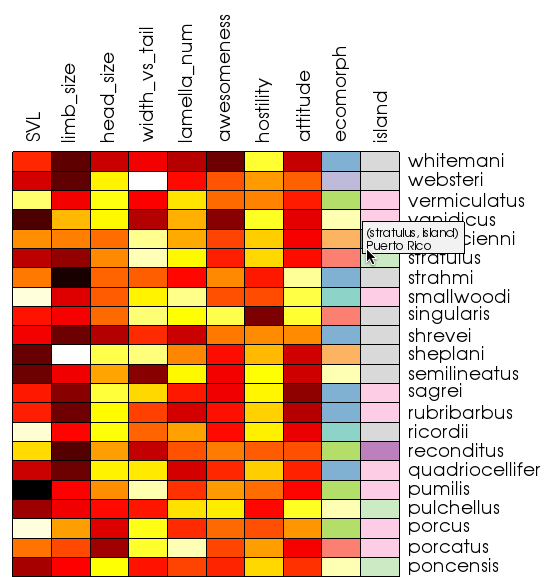
The heatmap above displays information about the characteristics of various species of anole lizards that are native to the Caribbean islands. The features of vtkHeatmapItem include:
- Separate color schemes for continuous (numerical) data and categorical (string) data. This makes it easy to determine at a glance what type of data is represented by each column of the heatmap. By default, continuous data is colored using a black-body radiation color scheme: black → red → yellow → white. The default color scheme for categorical data is ColorBrewer’s qualitative set #3. This color set was designed to represent separate classes of data, as opposed to differing magnitudes.
- When you place your mouse over a cell of the heatmap, a tooltip displays the underlying data value. This makes it possible to explore the precise values of the data without having to refer back to the input data table. The tooltip also displays the names of the row and column you are focused on. This is particularly convenient when viewing large heatmaps.
- Pan & zoom interactivity (same as vtkDendrogramItem)
- The ability to rotate the visualization by 90° increments (same as vtkDendrogramItem).
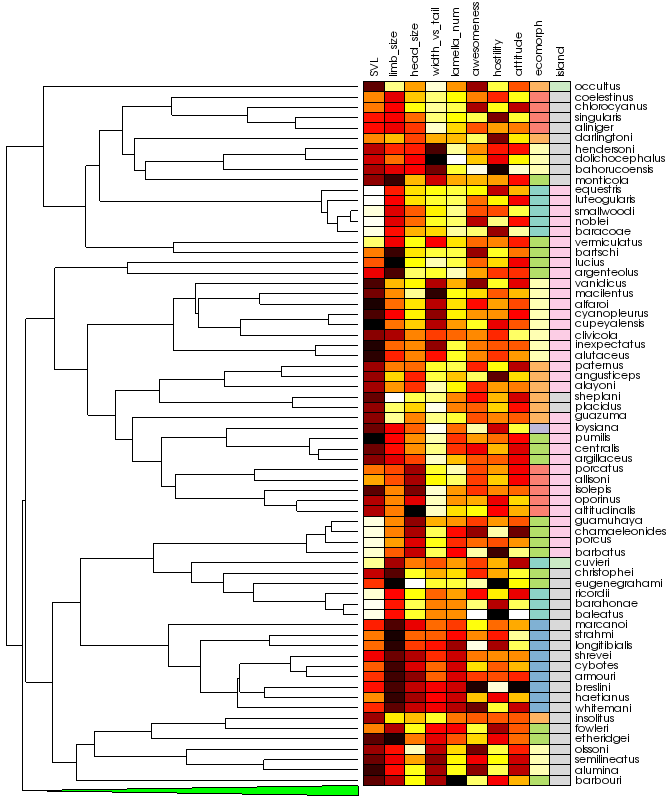
As the name implies, vtkTreeHeatmapItem combines a vtkDendrogramItem and a vtkHeatmapItem into a single, connected visualization. Above, we see an expanded version of our anole heatmap combined with its phylogenetic tree. In addition to the features of its two component classes, vtkTreeHeatmapItem also offers the following:
- Automatic reordering of heatmap rows to match the tree structure. The rows of the heatmap are rearranged so that they match the order of the leaf nodes in the tree. This step can yield some interesting results. If you look at the rightmost column of the heatmap above, you’ll notice large blocks of continguous colors. This makes intuitive sense. Species of anoles from a particular island are likely to be more closely related to each other than they are to anoles from a different island.
- Collapsing a subtree also hides the corresponding rows in the heatmap.
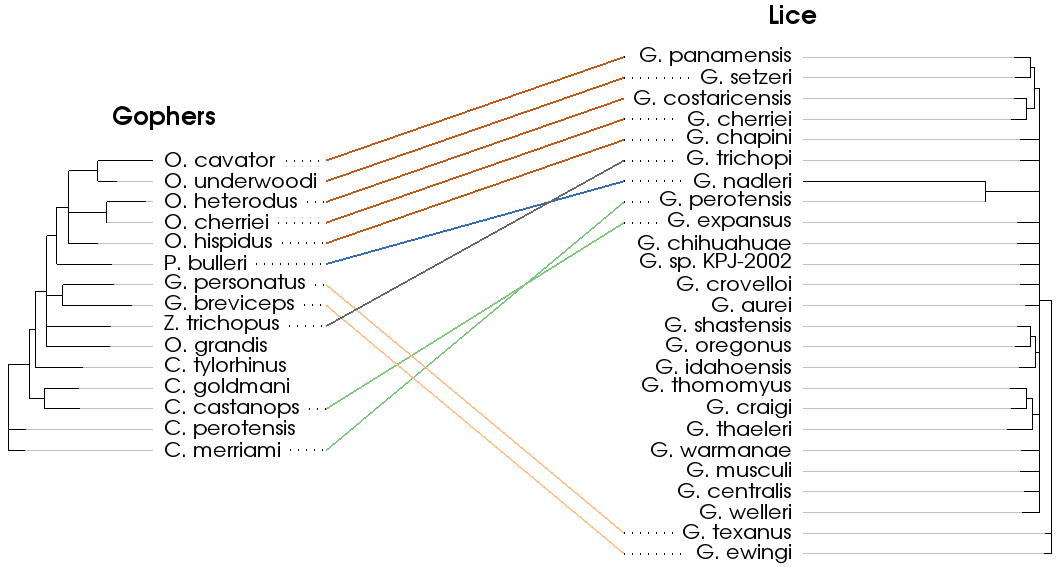
The tanglegram visualization shows how two trees are related. The example above depicts the species of lice that parasitize various species of pocket gophers. This visualization allows us to see how these two groups of organisms have co-evolved over time. The lines drawn between the two trees are referred to as “tangles”. Among the features of vtkTanglegramItem are:
- Automatic reorganization of the secondary tree to minimize tangle crossings. This improves the appearance of the visualization and makes it easier to understand.
- The ability to color tangles by user-defined categories. In the example above, the tangles are given different colors based on the genus of the pocket gopher.
- If a subtree is collapsed, any tangles connected to the collapsed leaf nodes are also hidden.
- The same ability to pan, zoom, and rotate as the other classes described in this article.
Thanks are due to the National Science Foundation and the Department of Energy for funding the development of these new visualization tools. We hope that you find them useful in your work. We welcome your feedback in the comments below, or on the vtkusers mailing list.