GeoNotebook: Data-Driven Quality Assurance for Geospatial Data

Chris Kotfila, Aashish Chaudhary, Petr Votava, Doruk Ozturk, Andrew Michaelis
Far from the days of radio-based deep space communication and telemetry, satellites used to gather GIS data today, are pouring terabytes of data back into science data systems (SDS) here on Earth. The data is cleaned and processed into terabytes of science products to be evaluated by researchers, who investigate the structure and changes of the Earth’s system, studying important topics like weather patterns, vegetation changes, water flow, tectonic action, and climate.
This massive amount of data creates both opportunity and challenge for the Earth science community. One of the biggest challenges is the ability of the science team to easily and quickly evaluate the quality of the data and the science processes across millions of files and petabytes of data. Because of the huge amount of data and long processing times, quality assessment (QA) is a critical step – for instance, one month of Web-Enabled Landsat Data (WELD) takes about two days of processing, with 32 stages of analysis, and uncaught errors at any of those steps will result in a long delay while data is re-processed.
For large processing systems, this is often accomplished by performing visualization and analysis of the data being processed, but once established these processes are tightly integrated with the production system and fairly inflexible. If there is a need for updated analysis, the component needs to be rewritten, tested and integrated into the production system and there is often no possibility of interactive investigation of the data quality. Additional evaluation is often based on sampling of small fraction of the data on which science team performs their own evaluation, which is often based on intuition and experience that often results in a simple yes/no answer on whether to continue with the data processing. The result: A time-consuming process with methods that aren’t reproducible and provide no way to track how the data quality was assessed throughout the process.
Kitware has partnered with The NASA Earth Exchange (NEX) to design GeoNotebook, a Jupyter Notebook extension created to solve these problems. Their shared vision: a flexible, reproducible analysis process that makes data easy to explore with statistical and analytics services, allowing users to focus more on the science by improving their ability to interactively assess data quality at scale at any stage of the processing.
Extending Jupyter Notebooks and Jupyter Hub, this python analysis environment provides the means to easily perform reproducible geospatial analysis tasks that can be saved at any state and easily shared. As the geospatial datasets come in, they are ingested into the system and converted into tiles for visualization, creating a dynamic map that can be managed from the web UI and can communicate back to a server to perform operations like data subsetting and visualization.
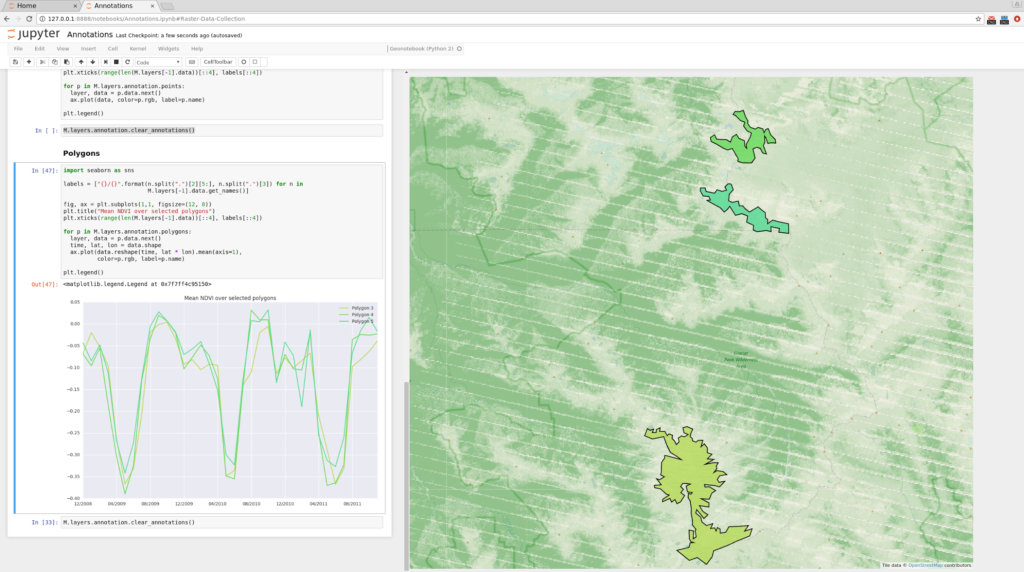
 Time series analysis over three annotated polygonal areas with GeoNotebook
With GeoNotebook, the science team describes the queries and visualizations that they would like to execute as a part of QA, which products they would like to evaluate and add any desired external products for validation. The queries are automatically run every time the pipeline reaches a stage requiring analysis, and the results become part of the metadata. The science team can then interact with the results or modify the queries, all from the web interface.

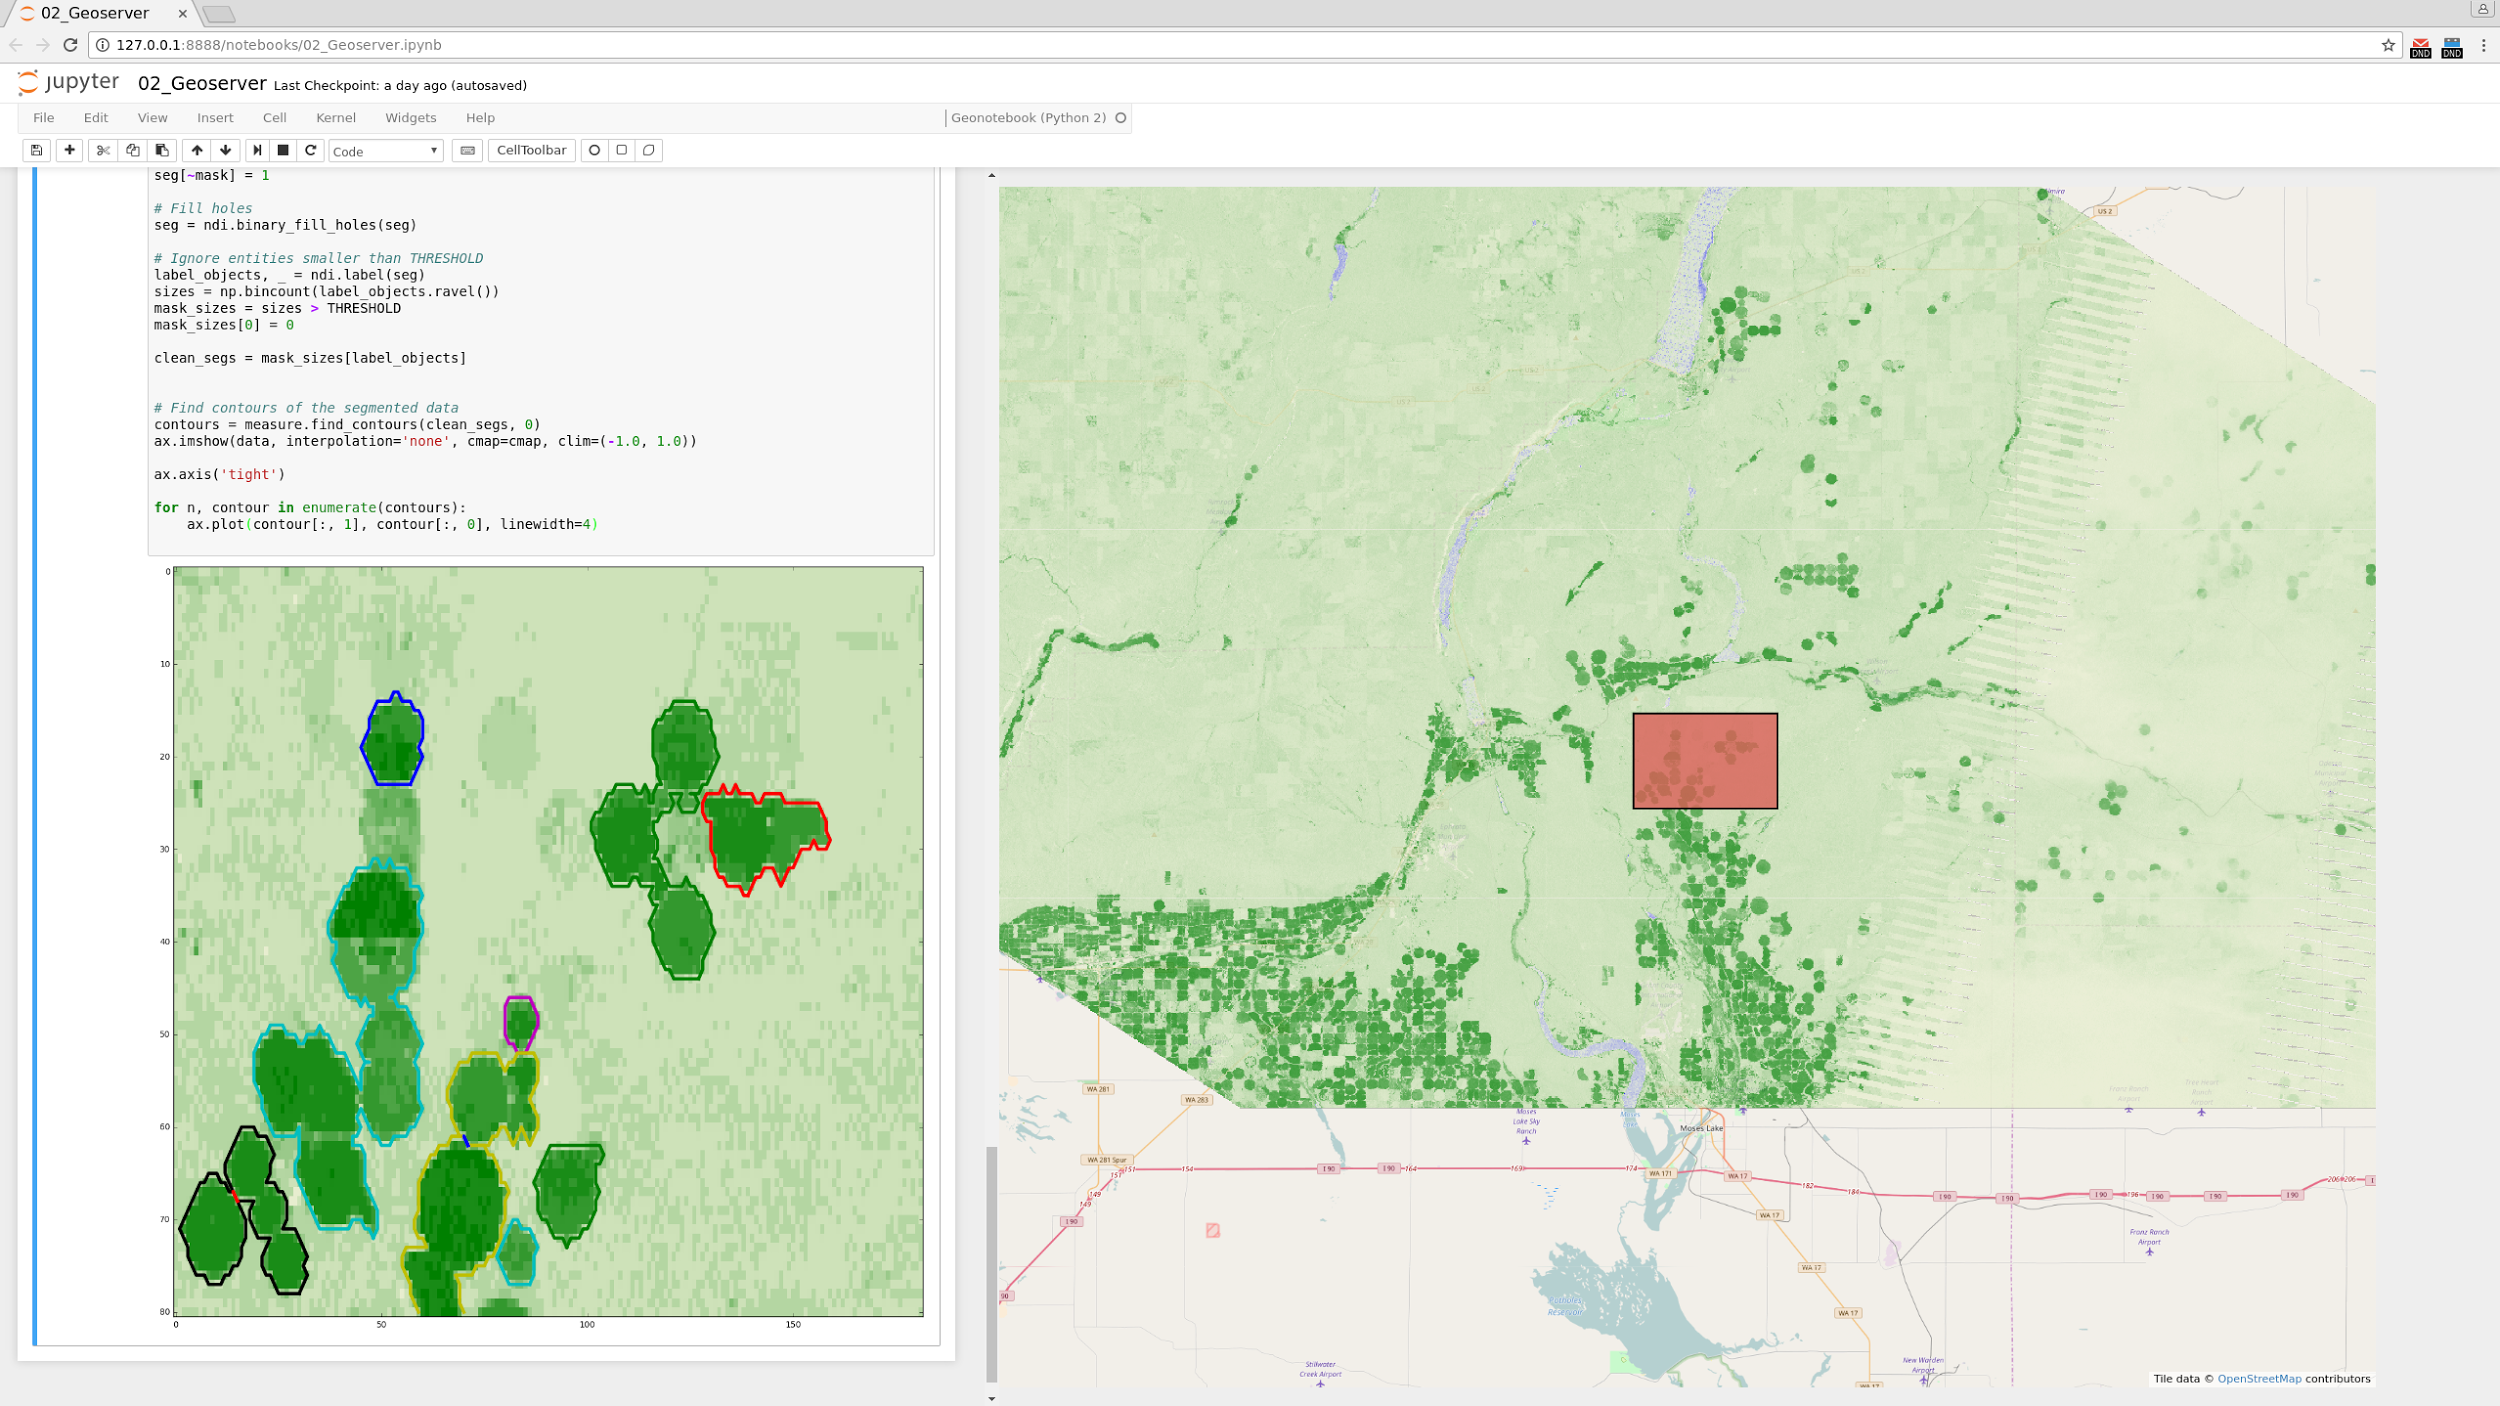
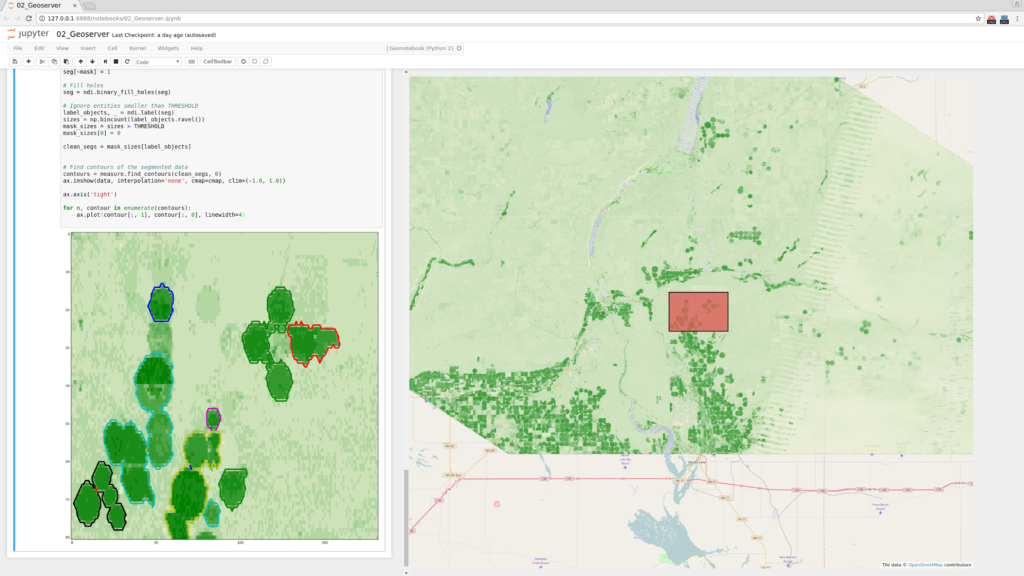
Automatic field segmentation of vegetation using NVDI with GeoNotebook
GeoNotebook builds on Kitware’s 18 years of experience in using state of the art techniques for data visualization and analysis to tackle the many challenges facing the scientific community. The software stack of GeoNotebook includes Kitware open-source geospatial visualization library GeoJS, and community developed tile rendering tools KTile.
Kitware has partnered with researchers, academics, government agencies, and commercial organizations across the globe in order to build open source tools and promote open science, as well as to develop and deploy software to address customer-specific problems and workflows.
Stay tuned for a more in-depth look at the technical components of GeoNotebook.
For more information about using GeoNotebook for geospatial analysis, comment below or contact kitware@kitware.com.