
Improvements to 3D Plots in VTK

Researchers working with 3D datasets often require the ability to draw plots for analysis and visualization. Toolkits such as MATLAB [2] and Tecplot [3] provide excellent support for drawing 2D and 3D plots. VTK [1] provides Charts API, which is primarily an API for drawing 2D charts such as scatterplot, bar chart, etc. vtkAxes, vtkAxisActor and vtkCubeAxesActor classes within VTK provide support for 3D plots.
vtkAxes, not to be confused with vtkAxis which draws 2D axes, creates three orthogonal axes centered at origin. vtkAxes provides basic functionality to provide a sense of a 3D plot given a 3D dataset as shown in Figure 1. vtkAxisActor provides basic means for drawing a 3D plot. It creates an axis with tick marks, corresponding labels, and a title for the axis. vtkCubeAxesActor provides an API for drawing and customizing 3D plots. vtkCubeAxesActor is a composite VTK actor that uses the bounding box of the input dataset and draws ticks along the edges (each edge is considered an axis) with proper labels for ticks and a title for axis. Internally, vtkCubeAxesActor uses vtkAxisActor to draw individual axes in three orthogonal directions.
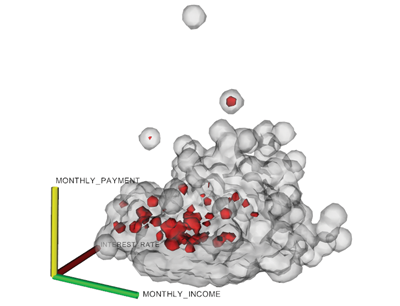
Figure 1. Financial data with three axes
For developers, the API for vtkCubeAxesActor was convenient in terms of functionality and simplicity. Unfortunately, the implementation of vtkAxisActor and vtkCubeAxesActor did not generate visually pleasing and usable 3D plots for arbitrary datasets. Figures 2, 3 and 5 demonstrate some of these issues. Careful analysis of these figures shows some of the major shortcomings of the vtkCubeAxesActor.
With regards to the axis and labels, there several issues regarding readability. The tick labels are drawn on top of it, making it difficult to view. Depending on the view angle, the axis title gets drawn on the axis and results in cluttered space. Additionally, axis and tick labels are drawn using fixed-size in 3D spaces and are static. Zooming in on the view makes the text very large, blocking the view of the dataset and the axis, while zooming out makes the text very small and difficult to read. The rotation of view causes the title and tick labels to intersect with the axis, and often with the dataset, and the fixed resolution of text causes aliasing effects resulting in poor readability.

Figure 2. Zoom-In View (Before)
Many solutions to these shortcomings were reviewed, and several key factors were taken into consideration, including the amount of effort required to implement a new algorithm; the scope of work in terms of the amount of change required in existing code base; the ability of the new algorithm to address major issues; flexibility provided by the new algorithm in terms of handling other minor issues in future; the ability to preserve the 3D feel of the existing implementation; and keeping the current API as much as possible.
After detailed study and several discussions with other developers at Kitware, we decided to adopt a solution that involved the addition of few classes and some changes in vtkAxisActor and vtkCubeAxesActor. Ideally, these new classes had to be independent of the existing implementation. This led to the development of a new class, vtkAxisFollower, which took care of the first three major issues mentioned earlier and improved the quality of rendering significantly. The new implementation follows these guidelines.
The axis title and tick labels are drawn parallel to the axis to avoid intersection. A constant screen size text for the axis and ticks is drawn, thus resolving the issue of occlusion to the dataset and readability-related issues. Labels are drawn from left-to-right to make it easy-to-read. A constant, user-specified offset from the axis is used for clarity and
consistency. A certain level of detail is provided to avoid drawing title and tick labels when their presence on the screen is not desirable, which is the case when a view is zoomed out so much that a dataset covers only few pixels on the screen.
Since most of the implementation is done in vtkAxisFollower, little code needed to be changed in vtkAxisActor and vtkCubeAxesActor. Figures 4 and 6 display the difference after VTK is updated to use vtkAxisFollower.
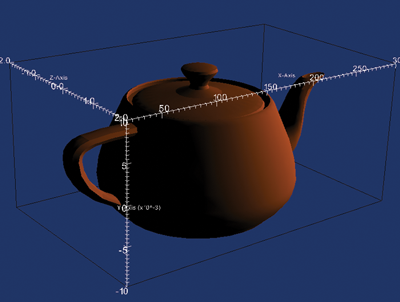
Figure 3. Zoomed out view (before)
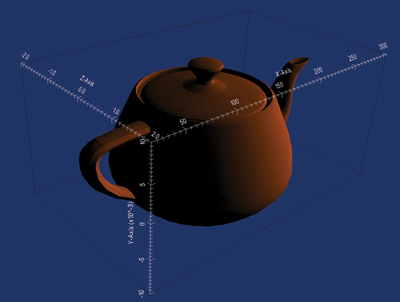
Figure 4. Zoomed out view (after)

Figure 5. Side view (before)
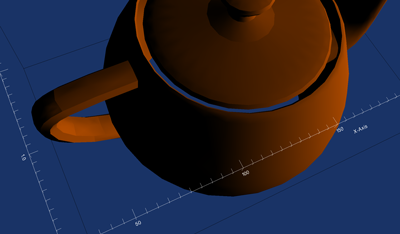
Figure 6. Side view (after)
In order to achieve the aforementioned functionalities, vtkAxisFollower first needed to identify the best plane to draw title and tick label text. The best plane for viewing is defined by the plane of maximum surface area when projected in the direction of viewing, whereas the edge of the plane remains parallel to the direction of a given axis. The first axis of the plane is defined by the direction of the axis. Its second axis is calculated by a performing a cross-product between the axis direction and the view direction. This direction vector is flipped if it is found to be going in towards the geometry. Since vtkCubeAxesActor supports three known axes (x, y and z axis type), pre-calculated vector directions are used to check if a vector is pointing towards or away from the geometry.
Also, to ensure text drawing from left-to-right, a test is performed using start and end points of a given axis. Both points of axis are projected in view space. A 180 degree rotation is applied if the start point of the axis is now found on the right side of the endpoint of the axis in view space.
To maintain a fixed pixel size for text, a scale factor is calculated given a camera’s view angle and its distance from the camera. Given camera view angle (θ), viewport vertical size (V), text distance from the camera (D), and a screen pixel offset (P), this factor is calculated as follows:

To avoid clutter, a visibility check is performed on each text displayed. Visibility is turned off if the text’s normal almost becomes perpendicular to the direction of projection. The axis and its corresponding title and labels are not shown if the dataset convers only few pixels on the screen.

Figure 7. Showing new vtkCubeAxesActor rendering in ParaView.
Figure 7 shows the rendering of new algorithm in ParaView [5]. Overall, it took about one-and-a-half weeks to implement and test the new algorithm.
Going forward, we would like to make following improvements to the rendering of 3D plots in VTK, including adding support for dynamic tick labeling; leveraging the algorithm published in “An Extension of Wilkinson’s Algorithm for Positioning Tick Labels on Axes” [4]; improving the algorithm to avoid overlapping of labels from different axes; adding the ability to handle non-uniform scaled datasets; adding support for constant pixel size ticks; providing an alternative, texture-based text rendering functionality; and providing an alternate hybrid implementation that could use 2D charts API.
Acknowledgements
Special thanks to Berk Geveci, Jeffrey Baumes, and Utkarsh Ayachit for their guidance and support on this project.
References
[1] Visualization Toolkit (VTK), http://vtk.org/
[2] Matlab software, http://www.mathworks.com/products/matlab/index.html
[3] Tecplot software, http://www.tecplot.com/
[4] Justin Talbot et al, “An Extension of Wilkinson’s Algorithm for Positioning Tick Labels on Axes”, IEEE Trans. Visualization & Comp. Graphics (Proc. InfoVis), 2010.
[5] ParaView, http://www.paraview.org/

Aashish Chaudhary is an R&D engineer in the Scientific Visualization team at Kitware. Prior to joining Kitware, he has developed graphics engine and open source tools for information and geo-visualization. Some of his interests are Software Engineering, Rendering, and Visualization.
An example of how to use it (vtkAxisFollower) would be nice.