
In vivo cell-cycle profiling in xenograft tumors by quantitative intravital microscopy

This post summarizes our effort to develop a computational framework for quantifying the effects of cancer drugs at a single-cell level in live mice using intravital fluorescence microscopy. A part of this work was recently published in nature methods.
Introduction to the Research Problem
Precise coordination of cell-cycle progression is essential to many biological phenomena, and it is of special interest in cancer research where cell-cycle deregulation is one of the disease hallmarks. Most of our knowledge in this direction stems from 2D cell culture systems. However, a large body of evidence shows that highly proliferating cells cultured on an artificial flat surface behave very differently from cells growing in a more physiological 3D environment. Therefore, a major challenge in cancer research is the development of accessible 3D model systems that accurately reflect in vivo cell-cycle behavior.
Initially, this was addressed using 3D in vitro culture systems. More recently, intravital microscopy has allowed live imaging of tissues in living animals at single-cell resolution over time. This opens the door to 3D experiments in a real physiological environment. Coupling this technology with recently developed fluorescent reporters of cell-cycle state enables the in vivo study of cell-cycle effects of experimental perturbations at single-cell resolution in both space and time.
Today’s best practice in interpreting such 3D microscopy data relies on visual inspection and manual quantification of select image events. This is tedious and prone to bias, and it limits us to small-scale studies with arbitrarily sampled data distributions. Automated analysis of 3D microscopy data, especially in an intravital setting, is challenging because of the relatively poor image quality and the presence of cells with varying sizes, shapes, and appearance in close contact with each other. Thus, whereas automated analysis is routine in the study of 2D monolayer cell cultures, the need for such tools for 3D image analysis is just beginning to be addressed.
Proposed Technological Solution
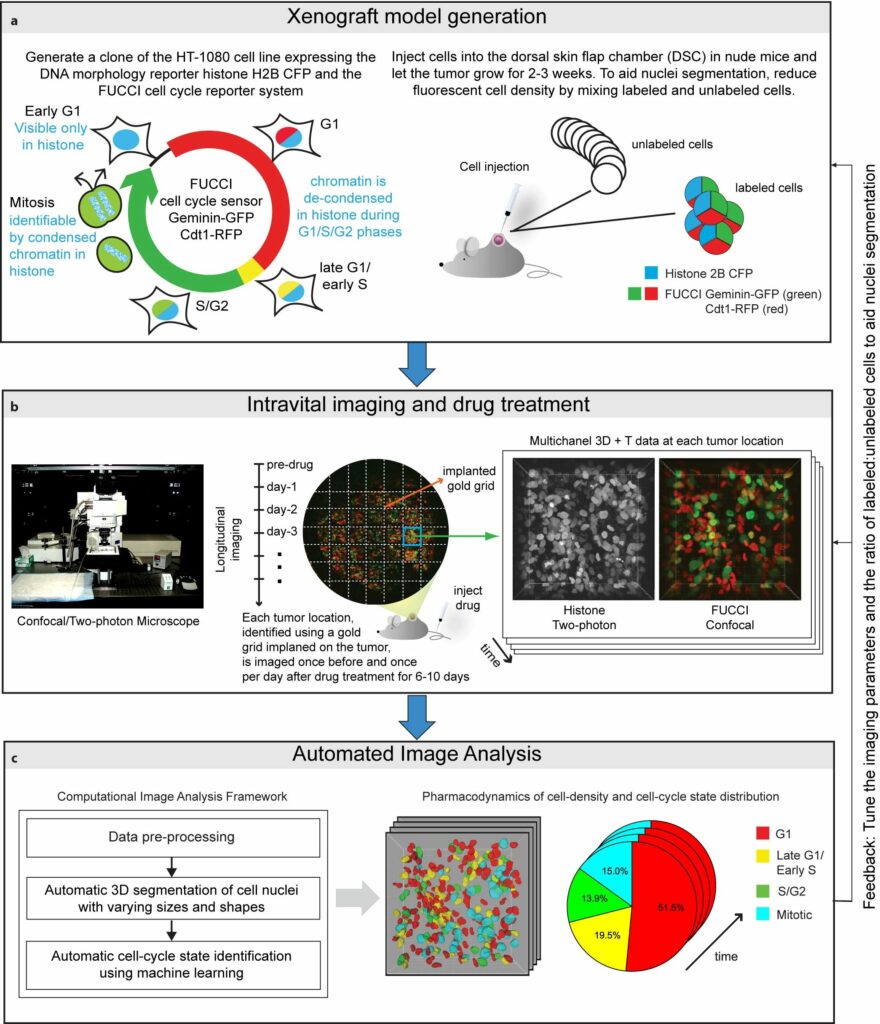
Here, we introduce an integrated workflow for automated in vivo cell-cycle profiling. The workflow integrates a high-resolution intravital imaging setup for longitudinal observations of tissues with a computational framework comprised of image analysis and/or machine learning methods for automated 3D segmentation and cell-cycle state identification of individual cell nuclei with complex and widely varying morphologies.
To begin, we generate a clone of the desired cancer cell line (we used an HT-1080 fibrosarcoma cell line) expressing the DNA morphology reporter histone H2B-CFP (this highlights the nuclei of all cells) and the FUCCI cell cycle reporter (this highlights G1 phase cells in red color, Late-G1/Early-S phase cells in yellow/orange, and S/G2/M phase cells in green). We then inject these cells into the dorsal skin flap chamber (back) of nude mice and let the tumor grow for 2-3 weeks. Next, we treat the mice with the desried cancer drug and image the tumor using a combination of a confocal and a two-photon microscope once every day for up to two weeks.
We use a gold-grid implanted on the tumor as a spatial reference system, enabling us to track/observe multiple locations on the tumor over time and generating a multi-dimensional data set for studying tissue changes in space and time. Then, we use marker-controlled watersheds coupled with a supervised hierarchical learning based region merging method for automatic 3D segmentation of cell nuclei and a supervised classification scheme for automatic identification of the cell-cycle state of each cell on the basis of image derived features.
Application: Quantiative analysis of spatiotemporal effects of cancer drugs at a single-cell level
To demonstrate the value of the proposed quantitative imaging workflow, we used it to track the spatiotemporal effects of chemotherapeutic drugs on cell cyle progression. Specifically, we focused on three cytotoxic drugs that are believed to kill cells undergoing mitosis.
- Paclitaxel: an established microtubule-interacting cancer drug which is used to treat breast, ovarian and lung cancers
- Eribulin: a novel microtubule-binding drug for late-stage breast cancer
- Isipinesib: a novel experimental KSP inhibitor that failed to achieve approval for clinical use
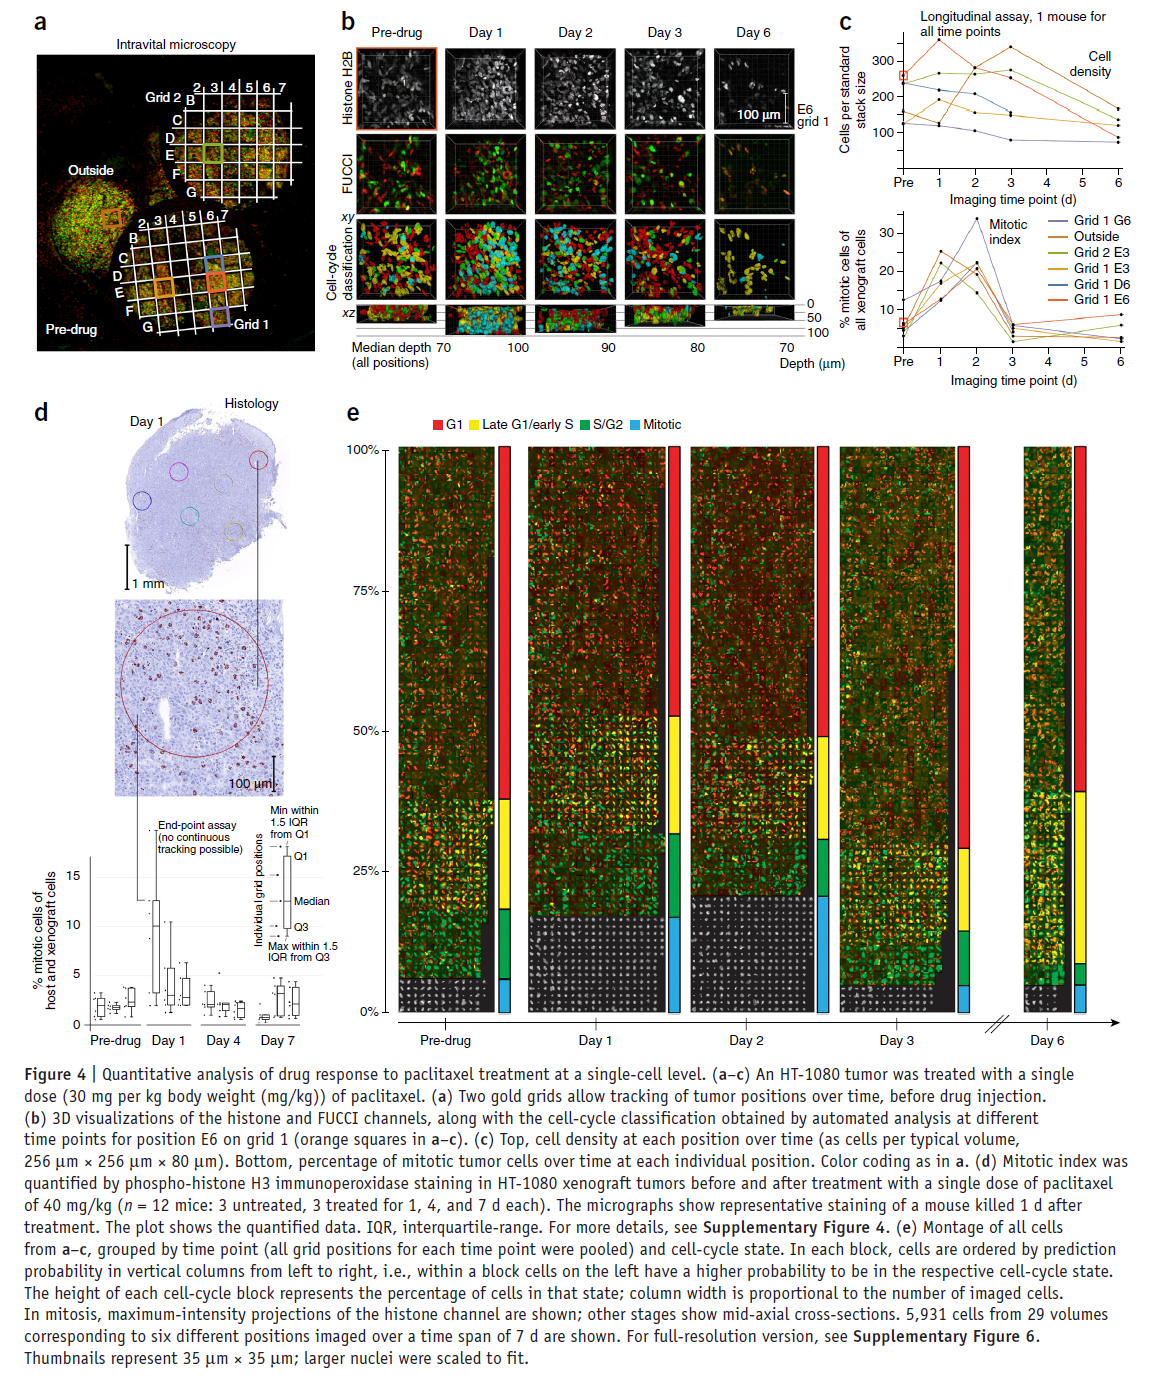
As an example, the figure below shows the quantitative analysis made possible using the proposed technological workflow for paclitaxel.
The next figure shows a comparison of the effects of the three chemotherapeutic drugs on cell-cycle progression and cell density.
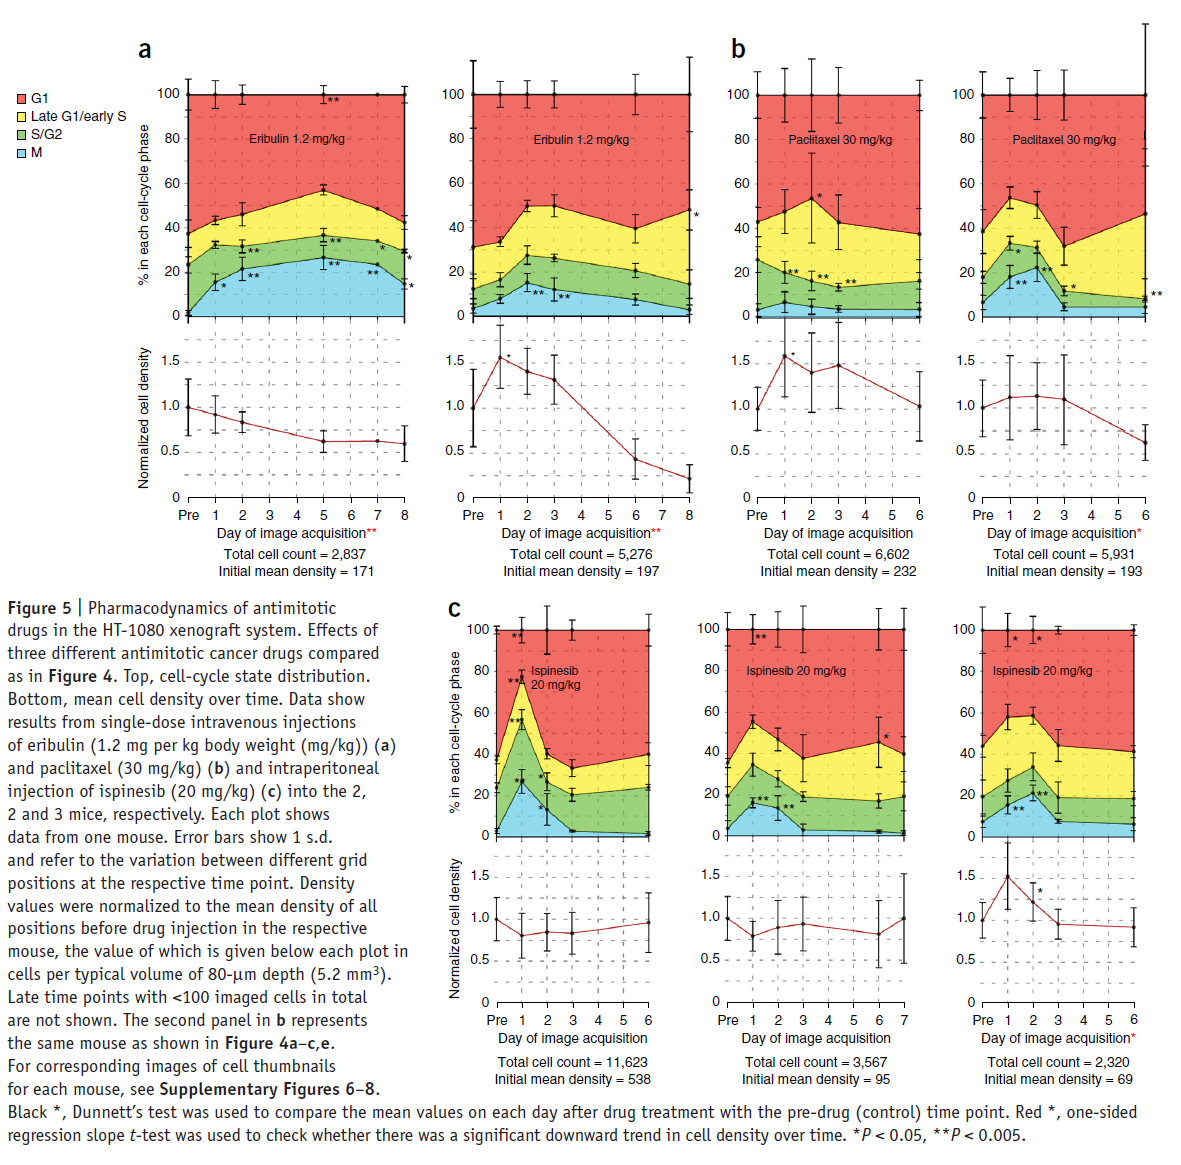
Although the cell-cycle profiles show a high amount of variability in timing and potency, in six out of seven mice, a single dose induced a highly significant mitotic arrest of up to 20% of the total cell population. Three out of four mice treated with MT drugs showed a reduced mean cell density after 6 d, compared to the pre-drug time point. Alternatively, in all mice treated with Ispinesib, the density was unchanged. This suggests lower antitumor efficacy of Ispinesib in this system, which is similar to the clinical experience.
In summary, our experiments show a similar and relatively low mitotic arrest for all three antimitotic drugs, suggesting that the reduction in tumor mass induced by the MT-targeting drugs may involve other, nonmitotic mechanisms.
Conclusion
The proposed workflow has substantial advantages over existing methods (such as flow cytometry and immunohistochemistry) to assess the cell-cycle state in vivo, which are detailed below.
- Because it is noninvasive and it does not require the euthanasia of a mouse for each measurement, our approach allows truly longitudinal observations of tumors after drug treatment at the single-cell level.
- In addition to the quantification of cell-cycle state distribution and cell density, a multitude of parameters at a single-cell level (for example, position, volume, shape and appearance) are calculated automatically from 3D image stacks.
- The display of individual cells filtered on the basis of metadata and calculated features in a 2D montage supports the conception and quick qualitative validation of new biological hypotheses and exploration of unexpected phenotypes.
Overall, our workflow facilitates unbiased, consistent and reproducible studies at a large scale. All elements required for the workflow featured here can be adapted to address different experimental questions.
Acknowledgements
This work as done as part of an interdisciplinary collaboration between Danuser Lab for Computational Cell Biology of Harvard Medical School under the supervision of Prof. Gaudenz Danuser, Mitchison Lab at Harvard Medical School under the supervision of Prof. Tim Mitchison, and Weissleder Lab of Massachusetts General Hospital under the supervision of Prof. Ralph Weissleder.