
Integrated Histogram, Opacity and Color Transfer Function Editor in Tomviz
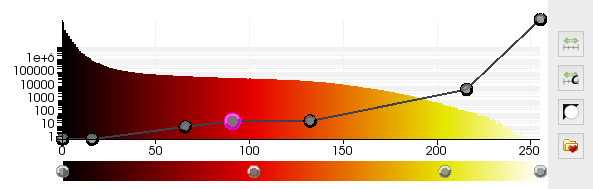
Tomviz deals primarily with volumetric data, which is currently regularly spaced (using vtkImageData internally). The two primary visualization techniques used are volume rendering and iso-contour surfaces, and from a very early stage of development Tomviz has featured a histogram of value populations above the main visualization widget. This was used to show where values were most numerous, and give researchers a general feel for the data.
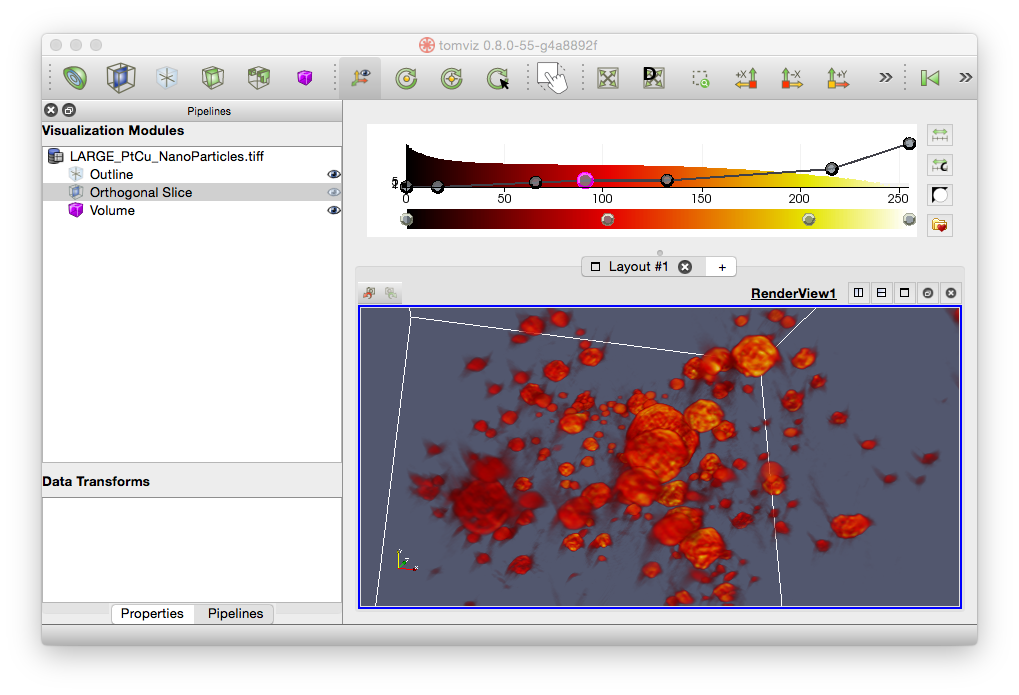
From the start we wanted to do more with the histogram, and we recently added the opacity and color transfer function editor. So instead of just displaying the histogram and the current color map you can interactively edit it, and see the results in the active visualization window. More recently we also added buttons to the right that enable you to choose from presets, rescale the range, and invert the active color map.
In the future we would like to also offer graphical rescaling of the range, and a categorized selection of presets for different types of data. As an open source community project, we would like your input. Are there other features you would like to see in this widget? Please let us know in the comments. Over the coming months we will publish a series of blog posts that highlight features in Tomviz, and would love to hear your feedback.
The Tomviz project is developed as part of a collaboration between Kitware and Cornell University under DOE Office of Science contract DE-SC0011385. This is a community project, and we are very pleased to take input and contributions from all in the community.