
Integration of ParaView Catalyst with Regional Earth System Model
Fully coupled multi-component and multi-scale modeling systems such as Regional Earth System Model (RegESM) are used to represent and analyze complex interactions among physical processes. A typical application of RegESM can produce tens of terabytes of raw data. This data determines the resolution of the spatial grid, the length of the simulation and the number of represented model components. The increased complexity of multi-component modeling systems results in extra overhead in disk input/output and network bandwidth. Thus, the systems require extensive resources for computation and storage.
Due to the increased complexity of multi-component modeling systems, the conventional post-processing approach has become insufficient to analyze and understand in detail fast-moving processes and interactions among model components [1]. In situ visualization has been used to overcome the limitations of the conventional approach. When compared to the conventional approach, in situ visualization can analyze key information that multi-component Earth system models generate in a higher temporal resolution. In addition, in situ visualization does not entail extensive code development and restructuring.
This article discusses in situ visualization and highlights work that tested its integration with RegESM. This work was presented in “Towards in situ visualization integrated model coupling framework for earth system science” at the Fourth Workshop on Coupling Technologies for Earth System Models [2].
Co-processing as part of RegESM
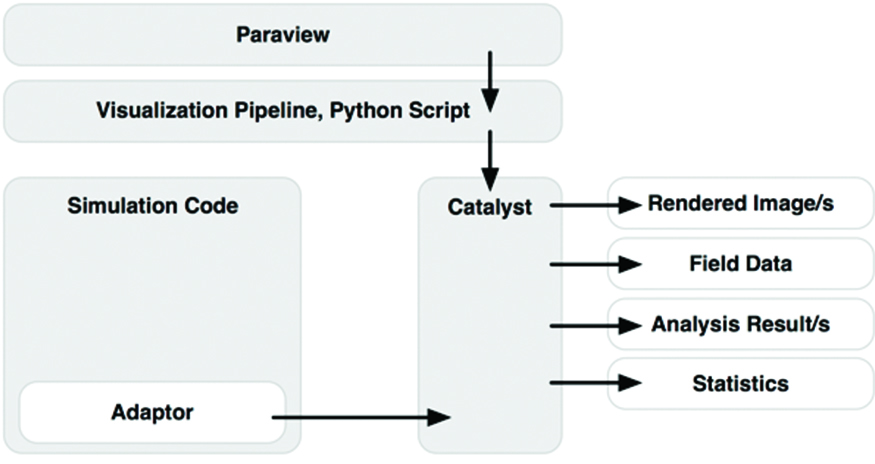
In a conventional simulation system (Figure 1), ParaView Catalyst integrates a visualization pipeline with simulation code through an adaptor. This adaptor acts as an abstraction layer or a wrapper layer. Custom adaptor code is developed in the C++ programming language. It transfers information from the simulation code to ParaView Catalyst.
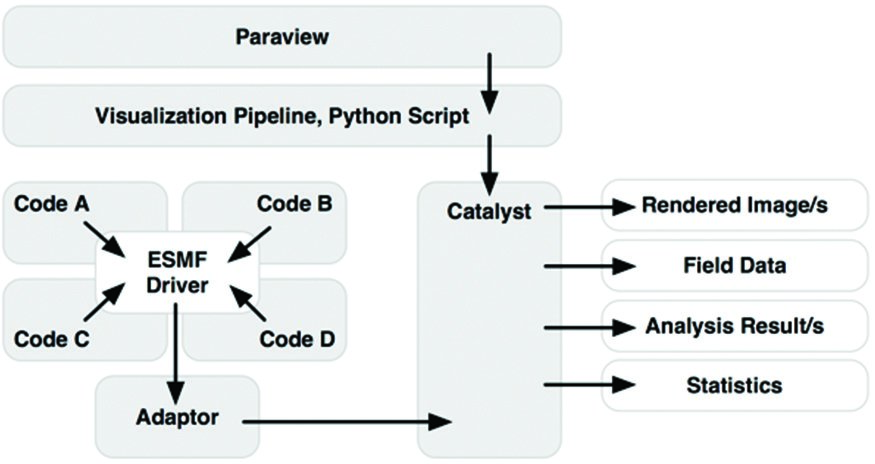
The new approach (Figure 2) aims to create a more generic and standardized co-processing environment for Earth system science. The approach integrates in situ visualization. In addition, the approach couples existing Earth system models with the Earth System Modeling Framework (ESMF) library [4] and the interface of the National Unified Operational Prediction Capability (NUOPC) Layer [5]. In the new approach, an adaptor interacts with an ESMF driver, which synchronizes the model components, the data exchange and the spatial interpolation that occurs among the computational grids of the model components.
Due to the nature of Earth system modeling and its demand for extensive computational resources, Earth system models are designed to take advantage of parallel programming through Message Passing Interface (MPI). Based on the parallelization of model components, Earth system models use two-dimensional (2D) domain decomposition to solve a set of equations such as a set of Navier-Stokes equations. The computational grid of an individual model component and its 2D decomposition configuration are represented by vtkMultiBlockDataSet and vtkStructuredGrid, respectively.
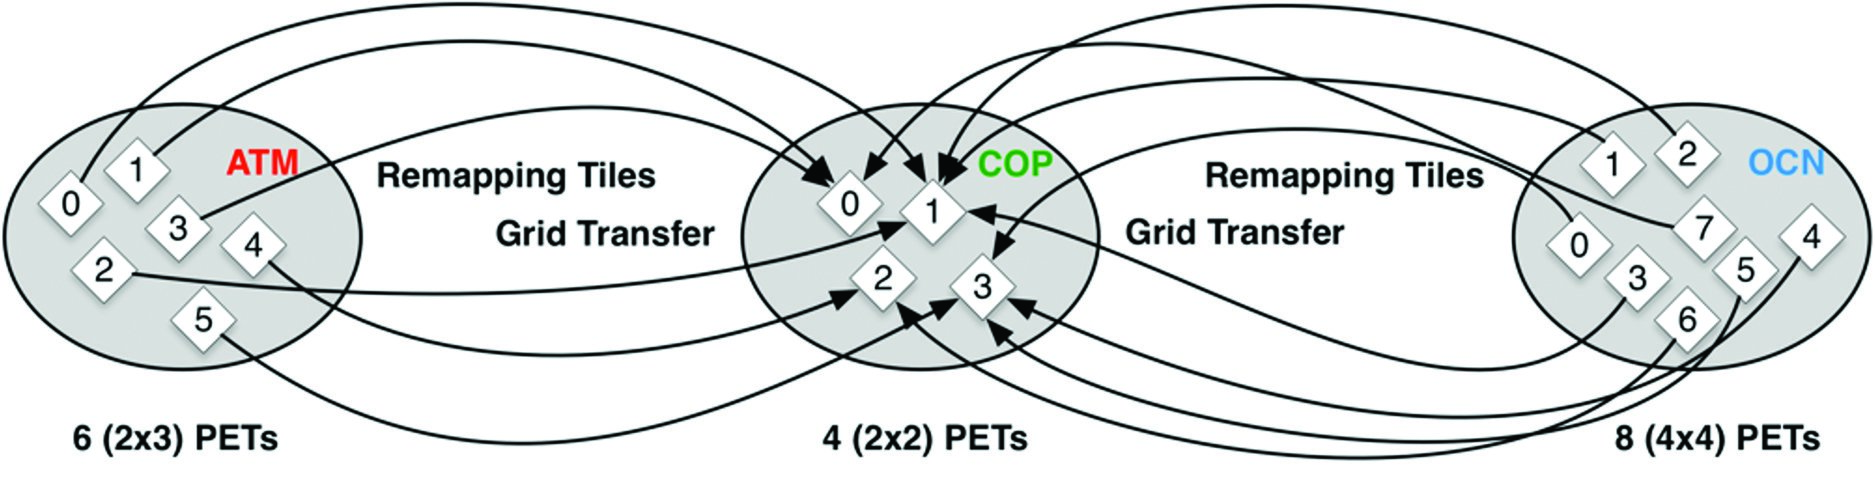
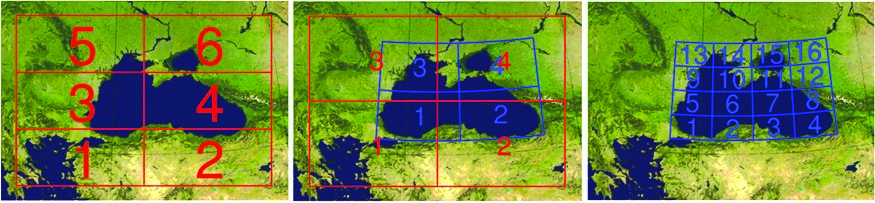
A problem arises when loosely coupled visualization and modeling systems are considered. The model components and the co-processing component may run on different computational resources or in different MPI communicators (e.g., MPI_COMM_WORLD). As Figure 3 indicates, in ESMF convention, computational resources are assigned Persistent Execution Threads (PETs). As Figure 3 also demonstrates, the number of MPI processes in the model components and the number of MPI processes in the co-processing component may differ. If this is the case, the 2D decomposition configurations will need to be restructured. The co-processing component is responsible for modifying the 2D decomposition configurations of the numerical grids (Figure 4).
g_coprocessor = vtkCPProcessor::New();
MPI_Comm handle = MPI_Comm_f2c(*fcomm);
vtkMPICommunicatorOpaqueComm*Comm = new
vtkMPICommunicatorOpaqueComm(&handle);
g_coprocessor->Initialize(*Comm);
After the co-processing component modifies the 2D decomposition configurations of the numerical grids, it passes them to the adaptor.
Using an Integrated System to Analyze Hurricane Katrina
To test the co-processing approach, ParaView Catalyst was integrated with version 1.1 of RegESM [6]. The state-of-the-art driver that is responsible for the orchestration of RegESM and the data exchange among the model components is mainly developed by Istanbul Techical University (ITU). RegESM can incorporate four different model components: atmosphere, ocean, wave and river routing. The test used two of these model components, atmosphere and ocean, to analyze Hurricane Katrina.
Hurricane Katrina was the costliest natural disaster and one of the five deadliest hurricanes in the history of the U.S. The storm is currently ranked as the third most intense landfalling tropical cyclone in the U.S. Hurricane Katrina was established on the coast of southern Florida as a Category 1 storm on August 25, 2005. It entered the central Gulf of Mexico and strengthened to a Category 5 storm on August 28, 2005.
To observe the evolution of Hurricane Katrina, a simulation was performed between August 27 and August 30, 2005. The atmosphere model component (from Regional Climate Model (RegCM)) was configured to have a horizontal resolution of 27 kilometers (170 latitude x 235 longitude) and 23 vertical sigma layers, which established almost one million grid points (Figure 5). The ocean model component (from Regional Ocean Modeling System (ROMS)) had a spatial resolution of three kilometers (655 latitude x 489 longitude) and 60 vertical layers, which established 19 million grid points (Figure 5). To exchange data between the model components and the co-processing component, a coupling interval of six minutes was selected. The coupling time step was set to three hours.
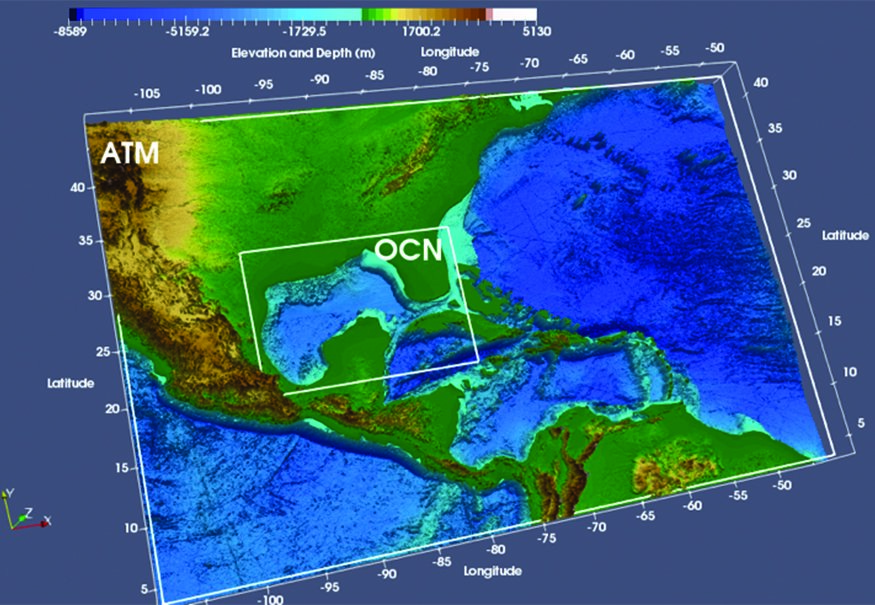
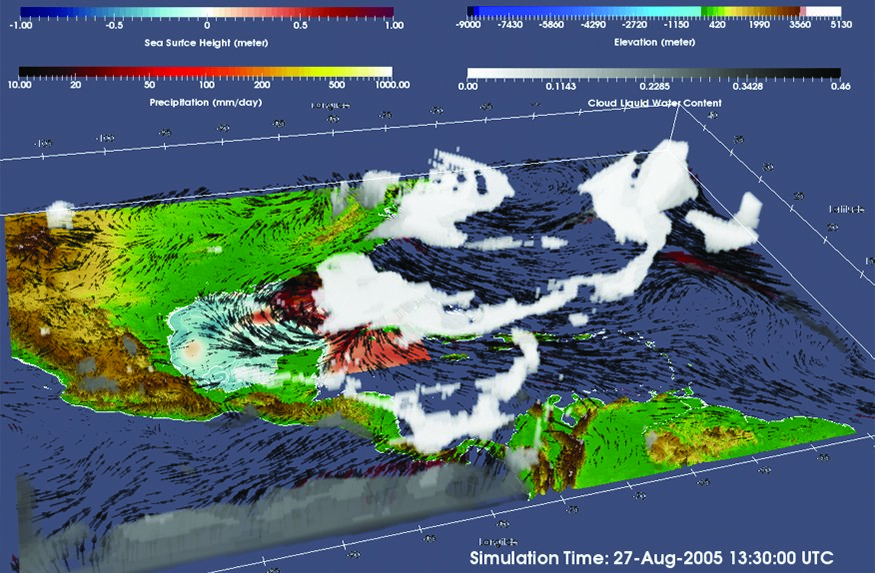
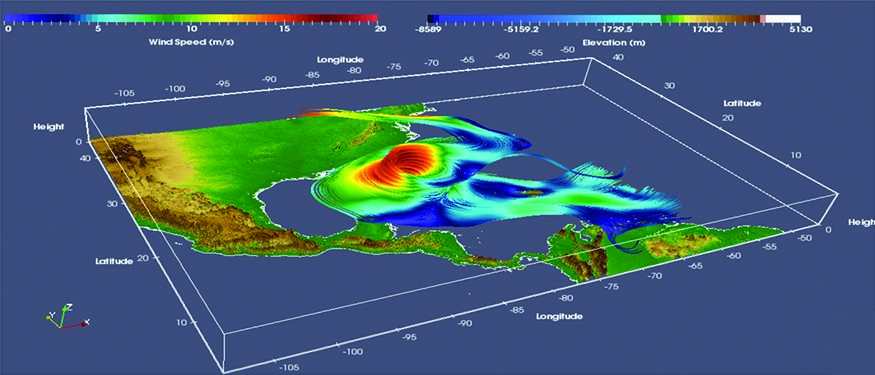
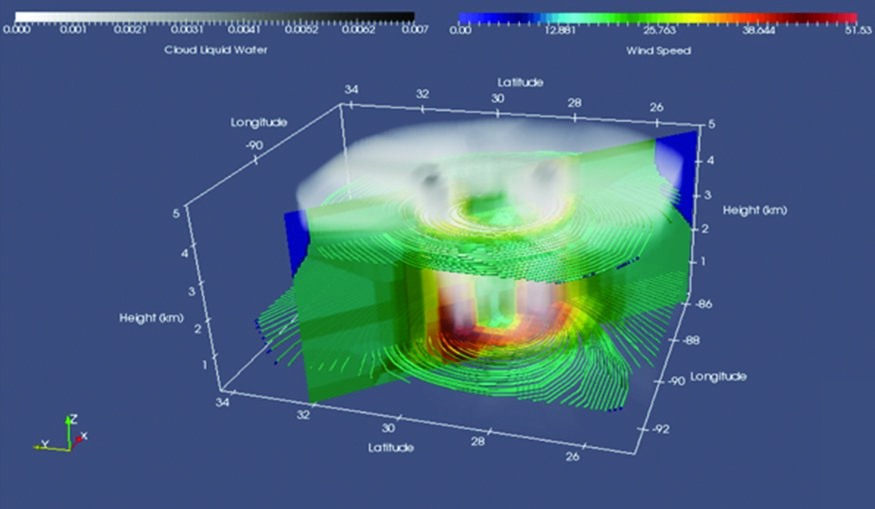
Figure 6 shows an snapshot of the integrated analysis of Hurricane Katrina. Surface wind vectors (in meters per second) were provided by the atmosphere model component. They are indicated as solid arrows. They reveal large-scale circulation in the region. In addition to surface wind vectors, clouds were retrieved using a three-dimensional relative humidity field and a direct volume rendering technique. Measurements of the surface height of the ocean (in meters) and surface currents (in meters per second) were provided by the ocean model component. They show the response of the surface of the ocean to the hurricane.
Due to the issue of numerical stability in the atmosphere model component, it is not possible to perform the simulation at a resolution greater than three kilometers. An additional non-hydrostatic atmosphere model component such as the Weather Research and Forecasting model, which is developed by the National Center for Atmospheric Research, can give a more detailed representation of the hurricane and its interaction with the ocean.
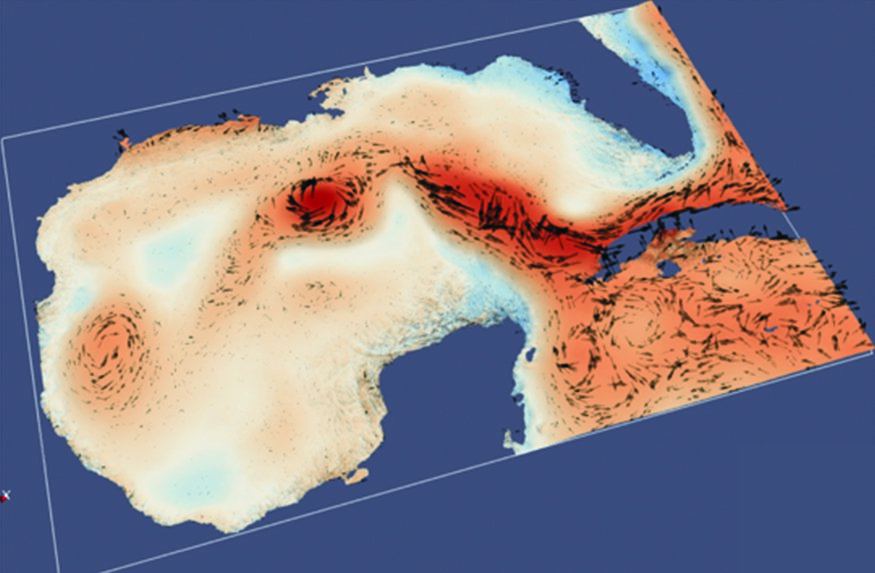
In addition to a general overview of the region, it is possible to analyze individual model components and features in greater detail. It is possible, for example, to extract the backward stream field from Hurricane Katrina (Figure 7).
Continuing Development
The new approach enhances and standardizes the interoperability between simulation code and an in situ visualization system. The model-coupling framework that the approach employs analyzes the high volumes of data that come from multi-component Earth system models. The ability to analyze data in a higher temporal resolution will open new possibilities, enhancing knowledge of non-linear interactions and feedback mechanisms among model components.
The plan is to make the interface of the ESMF library more generic. This will allow adaptor code to be used by coupled modeling systems other than RegESM. The overhead of the in situ visualization component of RegESM is another important topic of future development. It will be investigated in a series of standalone and coupled model simulations and in various visualization pipelines. The results of the benchmark simulations will be used to improve the overall performance of RegESM.
In addition, future work will investigate a way to automatically assign the PETs that are used by the co-processing component to graphical processing unit (GPU) resources. This work will increase efficiency in hybrid computing systems that are configured with nodes, with and without acceleration support.
Acknowledgments
This work was supported by a research grant (116Y136) from The Scientific and Technological Research Council of Turkey. The computing resources used in this work were provided by the National Center for High Performance Computing of Turkey under grant number 5003082013. The Quadro K5200 used to develop the prototype version of the system was donated by NVIDIA Corporation as part of its Hardware Donation Program.
Thanks go to Rocky Dunlap and Robert Oehmke from the National Oceanic and Atmospheric Administration (NOAA) Earth System Research Laboratory (ESRL) and Cooperative Institute for Research in Environmental Sciences (CIRES), Gerhard Theurich from Science Applications International Corporation and Andrew Bauer from Kitware for their very useful suggestions, comments and support.
References
- Ahrens, James, Sébastien Jourdain, Patrick O’Leary, John Patchett, David H. Rogers, Patricia Fasel, Andrew Bauer, Mark Petersen, Francesca Samsel, and Benjamin Boeckel. “In Situ MPAS-Ocean Image-Based Visualization.” Paper presented at The International Conference for High Performance Computing, Networking, Storage and Analysis, New Orleans, Louisiana, November 16-21, 2014.
- Turuncoglu, Ufuk Utku. “Towards in situ visualization integrated model coupling framework for earth system science.” Presented at the The Fourth Workshop on Coupling Technologies for Earth System Models, Princeton, New Jersey, March 20-22, 2017.
- Kitware, Inc. “Visualize Your Data With VTK.” https://www.vtk.org.
- Collins, Nandy, Gerhard Theurich, Cecelia DeLuca, Max Suarez, Atanas Trayanov, V. Balaji, Peggy Li, Weiyu Yang, Chris Hill, and Arlindo da Silva. “Design and Implementation of Components in the Earth System Modeling Framework.” The International Journal of High Performance Computing Applications 19 (2005): 341-350;
Hill, Chris, Cecelia DeLuca, V. Balaji, Max Suarez, and Arlindo da Silva. “The Architecture of the Earth System Modeling Framework. Computing in Science and Engineering 6 (2004): 18-28. doi: 10.1109/MCISE.2004.1255817;
University of Colorado Boulder. “ESMF.” https://www.earthsystemcog.org/projects/esmf. - University of Colorado Boulder. “NUOPC.” https://www.earthsystemcog.org/projects/nuopc.
- Turuncoglu, Ufuk Utku, and Sannino, Gianmaria. “Validation of newly designed regional earth system model (RegESM) for Mediterranean Basin.” Climate Dynamics 48 (2017): 2919–2947. doi: 10.1007/s00382-016-3241-1;
GitHub, Inc. “uturuncoglu / RegESM.” 2017. https://github.com/uturuncoglu/RegESM. - Turuncoglu, Ufuk Utku, “Visualization of Fully Coupled Regional Earth System Model (RegESM) Simulation of Hurricane Katrina,” Vimeo video, 1:01, posted by “Ufuk Turuncoglu,” March 15, 2017, https://vimeo.com/208454979.
 Ufuk Utku Turuncoglu is an associate professor at Informatics Institute at ITU in Turkey. His main areas of interest are computational simulation of atmosphere and ocean model components, visualization with in situ techniques, process automation with scientific workflow systems and climate science. He is also interested in the design and development of coupled Earth system models.
Dear Sir,
I’m AJ from China, I’m studying for the visualization by using the paraview.
I would like to know how to convert the wind vector from the wrfout (WRF model) to the vtk files.
How to extract the wrfout model as u,v for wind speed and plot by using the stream tracer in Paraview.
Could please explain me for these?
Thank you very much.
Best regards,
AJ