Introducing GeoJS

Introducing GeoJS
GeoJS is a new javascript library for visualizing geospatial data in a browser. It is completely open source and is hosted at https://github.com/OpenGeoscience/geojs. We started the project in response to the need for an open-source JavaScript library that can combine traditional geographic information systems (GIS) and scientific visualization on the Web. Many libraries, some of which are open source, support mapping or other GIS capabilities, but lack the features required to visualize scientific and other geospatial datasets. For instance, such libraries are not be capable of rendering climate plots from NetCDF files, and some libraries are limited in regards to geoinformatics (infovis in a geospatial environment). While libraries such as d3.js [1] are extremely powerful for these kinds of plots, in order to integrate them into other GIS libraries, the construction of geoinformatics visualizations must be completed manually and separately, or the code must somehow be mixed in an unintuitive way.
We there developed GeoJS with the following motivations:
• Create an open-source geovisualization and GIS library that combines scientific visualization with GIS and informatics.
• Develop an extensible library that can combine data from multiple sources and render from multiple backends.
• Build a library that works well with existing scientific visualizations tools such as VTK.
In the following sections, we will discuss the GeoJS API, along with a few applications we have developed as part of the ClimatePipes project [2].
API Overview
GeoJS is supported by a hierarchy of classes, which define basic interfaces for the objects used in the API.
Maps
The entry point for developer interaction with the API is the geo.map class. As with most object constructors in GeoJS, the map constructor takes an object containing optional parameters.
map = geo.map(
{
“node”:
“#map”,# The DOM node to contain the map
“center”: [40, -100],
# The initial lat/lng center point
“zoom”:2
# The initial zoom level
}
);
The map serves as the root of the scene tree and contains georeferencing functions that can be used in converting to and from pixel coordinates and geographic coordinates.
# Get the pixel coordinates of the point 40° N, 100° W
>>> map.gcsToDisplay({x: -100, y: 40})
{x: 100, y: 100}
# Get the geographic coordinates of the pixel at (100, 100)
>>> map.displayToGcs({x: 100, y: 100})
{x: -100, y: 40}
Finally, the map provides a uniform looping mechanism for drawing synchronized animations within its layers. Running an animation from a map containing animatable layers is a simple matter of calling map.animate().
Layers and Renderers
A layer is an abstract representation of content visible to the user. Layers are like transparent sheets placed in a stack. Visible features on one layer will cover features on the layers below. In addition, only the top layer of the stack can directly receive mouse events. The event handling interface described below allows layers to respond to mouse events and map navigation in a uniform manner.
In terms of responding to map navigation events such as panning, layers come in two varieties: sticky or non-sticky. A sticky layer will automatically transform features contained within it to maintain its position relative to the map. This is useful for geographic features such as markers placed at a specific latitude/longitude. A non-sticky layer will not automatically transform. One might use this sort of layer for legends that remain fixed on the screen or for features that require customized map navigation behaviors.
Along with each layer is a renderer, which is responsible for actually drawing the features. Every layer has exactly one renderer and every renderer has exactly one layer. Renderers currently come in two varieties: geo.vglRenderer and geo.d3Renderer. The vgl renderer draws features in a WebGL context via the dependent vgl module [3], while the d3 renderer draws features inside an SVG element using the d3 library. Both renderers not only have the same top-level API, but they also contain hooks to obtain low-level contexts for advanced usage.
In order to draw and use a map object, a special layer called a reference layer must be attached to the map. The reference layer is responsible for specifying the coordinate system and translating mouse and keyboard events into map navigation events. Currently, only one reference layer class exists in GeoJS: geo.osmLayer. This layer fetches tiles from the open street maps tile server to render tiles on demand. This layer is created as follows:
osm = map.createLayer(“osm”);
Feature Layers
Feature layers are a specialization of a layer that allow the user to create features such as circles and polygons over the map. The feature layer object is instantiated directly from the map object with an optional parameter specifying the target renderer.
layer = map.createLayer
(“feature”, {renderer: “d3Renderer”});
Feature layers contain an interface to create feature objects, which are sets of drawable shapes. Out of necessity, each feature type has its own API for setting coordinate positions and rendering styles. The general scheme, however, is roughly consistent with the following example.
layer.createFeature(“point”)
.positions([{x: -100, y: 40}, {x: -110, y: 35}])
.style({color: [1, 0, 0], size: [10]});

Figure 1. Points feature example in GeoJs
Objects and Events
The lowest level class from which all other classes inherit is core geo.object. This class provides all objects with a timekeeping mechanism, as well as with the interface for the internal events system. Another important base class is geo.sceneObject. From the geo.sceneObject class, all drawable objects are derived.
Meanwhile, the sceneObject defines a tree structure through which events are propagated. An event in the scene tree first propagates up the tree from parent to parent until it reaches the root node. Once the event reaches the root, the node calls its own handlers and then triggers the event on all of its children. A Parent node can block events from propagating up the scene tree, as well as prevent its children from receiving events that originated from a different branch. The scene tree event model is what allows events to propagate through layers and react together.
Testing
GeoJS is released with a broad range of unit tests, ensuring that changes do not break API calls and that the rendering style and the behavior stay consistent. There are several unit test frameworks, from Jasmine [4] tests run with PhantomJS [5] to end-to-end multi-browser tests run with Selenium [6]. The test frameworks allow the developers to add new tests easily, often just by adding a jasmine spec in a new file. Each test is automatically integrated into the build and the dashboard. Each test also has built-in code coverage reporting. The master branch is run nightly on dashboard machines that report to CDash [7]. Continuous integration testing is performed for every push using Travis-CI [8], whose results are also summarized by CDash.
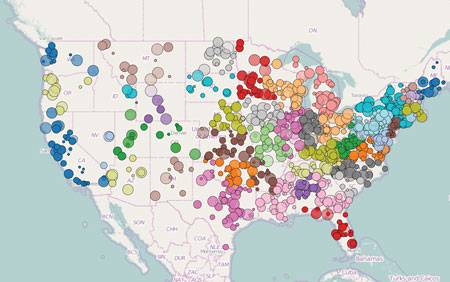
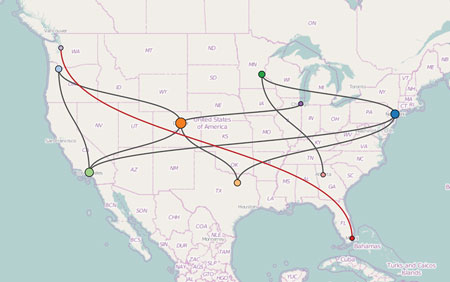
Figure 2. Examples of applying customizing point and graph features using the style API
Applications
The DOE ClimatePipes project uses GeoJs as the framework for its client-side visualization. The backend is written in Python and uses CherryPy [9] and MongoDB [10] as a data store. The backend sends data to the client side in GeoJSON [11] that can be parsed and rendered by GeoJs.
ClimatePipes Archives
The archive application enables users to access climate and geospatial datasets hosted on the Earth System Grid Federation (ESGF [12]) and local instance of MongoDB [4] using various keywords, as well as temporal and spatial constraints. Most of the climate datasets are available in the NetCDF format. A VTK pipeline is used to read in the dataset and convert it to the GeoJSON [11] format. The JSON is then streamed to the client side for rendering. GeoJs also supports animation. Animation is vital, as many of these datasets have a temporal component.

Figure 3. Screenshot of ClimatePipes’ Archive application
ClimatePipes Floodmaps
This application is designed to illustrate the effects of sea level changes on coastal regions. The application builds on the elevation data (90 meter resolution) from Shuttle Radar Topography Mission [13]. In order to achieve a responsive experience, the data is aggregated to several levels of detail. Thus, as the user zooms in, the application displays higher-resolution data. The application uses lower-resolution data when the user zooms out to maintain real-time performance.
The flood level is calculated using a native selection of all points with an elevation that is less than the selected rise. A PCL [14] outlier filter is used to remove points that are not clustered along the coastline, such as inland bodies of water. The visualization in GeoJs is completed using point sprites that are colored based on the change in sealevel, which results in a heatmap effect.
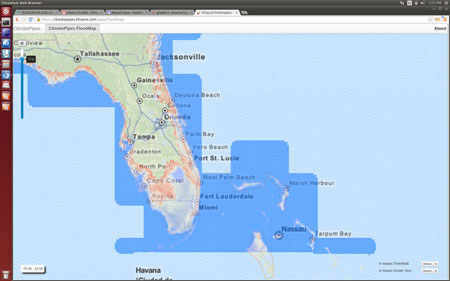
Figure 4. Screenshot of ClimatePipes Floodmaps application
Future Developments
GeoJs is in a continuous state of development with various projects at Kitware, where it is used to visualize data in a geospatial context. We have been working on adding new features and improving the API based on feedback from other developers and from our collaborators. Specifically, we are working on the selection API and on developing new features that use WebGL as the backend. We are also working on heatmaps and flow visualization features. We would like for developers outside of Kitware to become involved in improving GeoJs and, possibly, in integrating it with other open-source GIS tools.
We would like to thank Berk Geveci and Patrick Reynolds for their support and contributions to GeoJS. We would also like to acknowledge the Department of Energy, as part of this work is supported by the ClimatePipes project (DOE SBIR Phase II (DE-SC0006493)).
References
1. http://d3js.org
2. ClimatePipes: http://www.kitware.com/source/home/post/114
3. WebGL visualization library:
https://github.com/OpenGeoscience/vgl
4. http://jasmine.github.io
5. http://phantomjs.org
6. http://docs.seleniumhq.org
7. http://my.cdash.org/index.php?project=geojs
8. https://travis-ci.org
9. CherryPy — A Minimalist Python Web Framework.” http://www.cherrypy.org
10. “MongoDB.” http://www.mongodb.org
11. GeoJSON. http://geojson.org
12. ESGF. http://esgf.org
13. “Shuttle Radar Topography Mission – Jet Propulsion Laboratory.” http://www2.jpl.nasa.gov/srtm
14. PCL – Point Cloud Library (PCL). http://pointclouds.org

Aashish Chaudhary is a Technical Leader on the Scientific Computing team at Kitware. Prior to joining Kitware, he developed a graphics engine and open-source tools for information and geo-visualization. His interests include software engineering, rendering, and visualization.

Chris Harris is an R&D Engineer at Kitware. His background is in software process and high performance messaging systems. He specializes in Web technologies and distributed computing.

Jonathan Beezley is an R&D Engineer at Kitware and is one of the principle developers of GeoJS. His research interests include geospatial visualization, Web technologies, and computational statistics.
Congrats geojs team!