
Kitware Introduces Resonant: Open-Source Data and Analytics


Kitware is excited to announce Resonant, a new open-source entry point into the data and analytics space. In recent years, there have been many advances in cloud computing, large-scale analytics tools, and Web standards. But, we found a lack of fully open, extensible, deployable, and integrative tools for researchers. To address this issue, we decided to build an open platform for reproducible end-to-end data science, called Resonant, which fully embraces the modern Web, Big Data technologies, and our software prowess. This article introduces the software components and use cases in Resonant’s three main areas of focus: data management, visualization, and analysis.
Data Management With Girder

From medical image archives to supercomputing simulation data, we are no stranger to large data sources. What we needed was a coherent, modern framework for managing data of all sorts, along with associated metadata, analyses, and visualizations. We built on the experiences of the Midas data management system to architect a platform focused on supporting Big Data, modern Web technologies, and extensibility. The resulting production-ready data system is called Girder [1].
Out of the box, Girder supports scalable storage in Hadoop Distributed File System (HDFS), Amazon Simple Storage Service (S3), and MongoDB. Girder also supports arbitrary metadata, as well as server-side and client-side plugins. Girder allows for remote scalable job execution, Ansible provisioning, simple pip installation, and Google account authentication. Girder also enables management of users, sharing, groups, and quotas. Each of Girder’s features is free and open source with a permissive Apache v2 license.
Girder is being put to good use in the COVALIC project [2]. Along with our academic and industry partners, we have combined Girder with decades of high-performance computing and medical imaging experience to produce a platform for hosting data-driven challenges. The entire system is built as a Girder plugin, using Girder’s authentication, storage, and data models to produce a site to design and host challenges and to collect submissions from participants. Girder uses Resonant’s execution engine, Romanesco, to perform custom evaluations of the submissions to produce a ranked leaderboard of challenge phases.
Visualization with GeoJS

Another task for analytics today is hosting visualizations for large and heterogeneous data sources. The Web is a natural place for this data, but we found scalable Web tools lacking, especially in the area of geoinformatics. Building on our experience with the Visualization Toolkit (VTK) OpenGL programming and scalable systems such as ParaView, we created GeoJS, a library for Web visualization of geospatial and other primarily two-dimensional data sources.
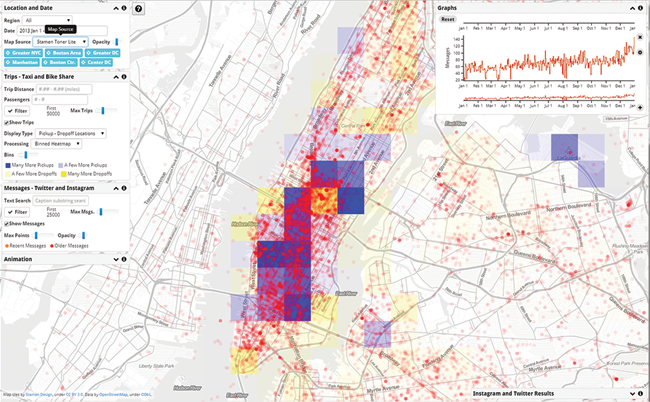
For the Defense Advanced Research Projects Agency (DARPA) XDATA large-data visualization program, we built a custom application using GeoJS and Girder, called Minerva Taxi, which is shown below. The application is able to directly render and animate through over one million geolocated elements from open taxi and social media sources. Minerva also supports live streaming of data, such as data from a Twitter firehose, allowing frontend applications to react in real time to new data.
Since the large set of queried data is made available to the Web client, it is possible to interactively filter, brush, animate, and re-bin the data, which would normally require server-side processing. Together, these pieces form applications that enable analyst workflows by (1) easily incorporating the necessary data to solve an analyst’s problem; (2) rapidly returning search results against that data; and (3) displaying results (even if they are large) and derived metrics on a map interactively, including ancillary linked visualizations for non-map data.
Analysis with Romanesco

Just as we see Girder as a uniform interface to modern data systems, Romanesco [4] is an integrative library for accessing analytic systems. Romanesco is a simple and flexible execution engine that supports workflows spanning multiple analytic engines that are traditionally disparate. At its core, Romanesco is a JavaScript Object Notation (JSON) specification for defining analyses and workflows. It currently supports R, Python, Docker, and Spark execution modes and enables objects such as R data frames, comma-separated values (CSV) files, NetworkX, and VTK objects to flow through workflow stages with automatic conversions. Results can be saved, shared, and viewed with a growing set of Web-based visualizations, including GeoJS.
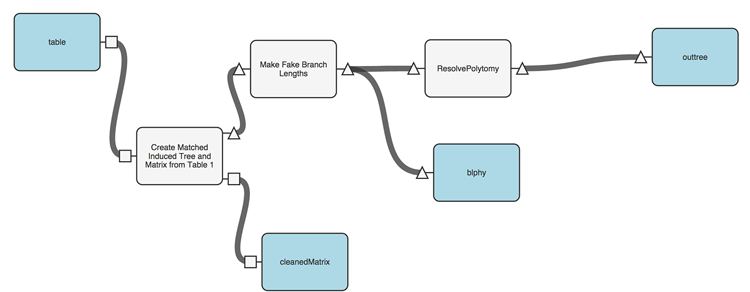
Romanesco comes paired with Resonant Flow, a Web application for editing and executing analyses and workflows. (See the below figure.) The application uses Girder to store both data and analyses and to manage the remote execution of analyses through Celery, a popular Python framework for distributed task management. Resonant Flow was primarily developed for the National Science Foundation (NSF) Arbor Workflows project [5], which provides new ways for phylogenetics researchers to share code and data, as well as to educate others on new methods.
Rapid Web Applications with Tangelo

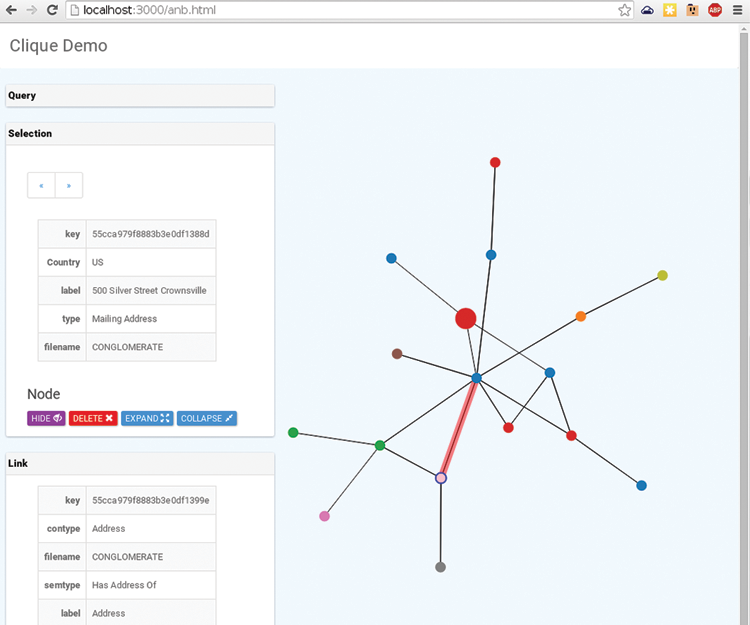
As we dove into the world of visualization on the Web, we realized we needed a simple but powerful platform for building Web applications. Tangelo [6] is a Web server that turns Python code into Web services, enabling applications to freely connect to Python-hosted resources such as databases and job control engines, while taking advantage of the wider, vibrant world of existing Python code, modules, and libraries. For example, you may want to build a Web application that retrieves data from a Mongo database in a particular format, performs some complex logic on it, and computes a simplified data product that is then handed to a JavaScript visualization library such as Data-Driven Documents (D3). Clique—a new, open-source JavaScript library for handling graphs and networks a small chunk at a time—works exactly this way.
Clique includes JavaScript functions for modeling, processing, and visualizing pieces of graphs, such as that which you would find when analyzing social media data. Clique also includes a general data backend—written in Python—that can pull large graph data from a variety of sources, including databases like MongoDB. In addition, Clique can store metadata about people (nodes) and their connections to each other (links). This metadata can be used to visualize parts of a particular network on the Web, allowing you to decide, for example, that two separate nodes in the network are actually the same person and to merge them into a single supernode that inherits the separate nodes’ connections in the right way. (See the below figure.)
The Future of Resonant
As adherents and advocates of the open-source philosophy, we want to put the future of Resonant in your hands. Please reach out to kitware@kitware.com if you have any ideas for possible features or collaborations; we would be happy to discuss them. If you want to get your hands dirty and try out Resonant for yourself, visit the “Getting Started” section of our site at http://resonant.kitware.com.
References
[1] Kitware, Inc. “Girder: A Data Management Platform.” Girder. http://girder.readthedocs.org.
[2] Kitware, Inc. “COVALIC.” COVALIC. https://challenge.kitware.com.
[3] Kitware, Inc. “Welcome to GeoJS’s Documentation!” GeoJS. http://geojs.readthedocs.org/en/latest/index.html.
[4] Kitware, Inc. “Romanesco: A simple, flexible execution engine.” Romanesco. http://romanesco.readthedocs.org/en/master.
[5] Arbor Revolutionary Workflow. “Home.” Arbor: evolutionary workflows for the tree of life. http://www.arborworkflows.com.
[6] Kitware, Inc. “Welcome to the Tangelo Web Framework!” Tangelo Web Framework. http://tangelo.readthedocs.org.

Jeff Baumes is a Technical Leader and data scientist at Kitware. His primary responsibility is to create tools that effectively visualize large and complex data, spanning relational, geospatial, temporal, bioinformatics, financial, and textual data.

Roni Choudhury is a research and development engineer at Kitware. He has directed the design and development of Tangelo from the ground up to bring advanced and experimental information visualization techniques to the web.

Patrick Reynolds is a research and development engineer at Kitware. He works within Kitware’s Medical Imaging, Computer Vision, and Data and Analytics teams, finding ways for these groups to better enable each other.

Jonathan Beezley is a research and development engineer at Kitware, where he is
one of the principle developers of GeoJS. His research interests include geospatial visualization, Web technologies, and computational statistics.

Aashish Chaudhary is a Technical Leader on the Scientific Computing team at Kitware. Prior to joining Kitware, he developed a graphics engine and open-source tools for information and geospatial visualization. His interests include software engineering, rendering, and visualization.

David Manthey is a research and development engineer at Kitware. He has experience working in the field of computer vision on audio and video distribution, storage, and processing, ranging from direct hardware control to user interfaces.

Zach Mullen is a research and development engineer at Kitware. His areas of interest include Big Data management and analysis, scientific visualization, quality software process, and computer securit