
Kitware Upgrades User Experience With ParaView 5.6
ParaView lets users customize shortcuts, favorite filters and read more types of data.
Kitware, in combination with the ParaView development community, made the second major release of ParaView this year, version 5.6.
“ParaView now has more facilities for customizing user interfaces,” said Berk Geveci, the senior director of scientific computing at Kitware. “These facilities can help users tailor interfaces to their needs and workflows, whether they be for structural analysis, fluid dynamics, astrophysics or climate science.”
ParaView is an open source software platform for computational science. Kitware will have multiple talks on the platform at booth 3735 at The International Conference for High Performance Computing, Networking, Storage, and Analysis (SC18). Examples include “What’s New with Kitware & HPC: High-performance Visualization and Analysis with ParaView” by Assistant Director of Scientific Computing Patrick O’Leary, “Ray Tracing Comes to ParaView” by Principal Engineer Dave DeMarle and “What’s New in ParaView” by Distinguished Engineer Utkarsh Ayachit. Kitware will also have a special Q-and-A session with ParaView developers for conference attendees.
Outside of scheduled activities, attendees can inquire about ParaView and the 5.6 release any day of the SC18 Exhibits. Highlights of the release include improvements to the user experience; new data ingestion and export capabilities, which support more file types; and new filters for molecular datasets.
User Experience Improvements
- A Customize Shortcuts tool lets users create and alter keyboard shortcuts for menu items.
- Favorites Manager allows users to keep filters on hand in the Filters menu.
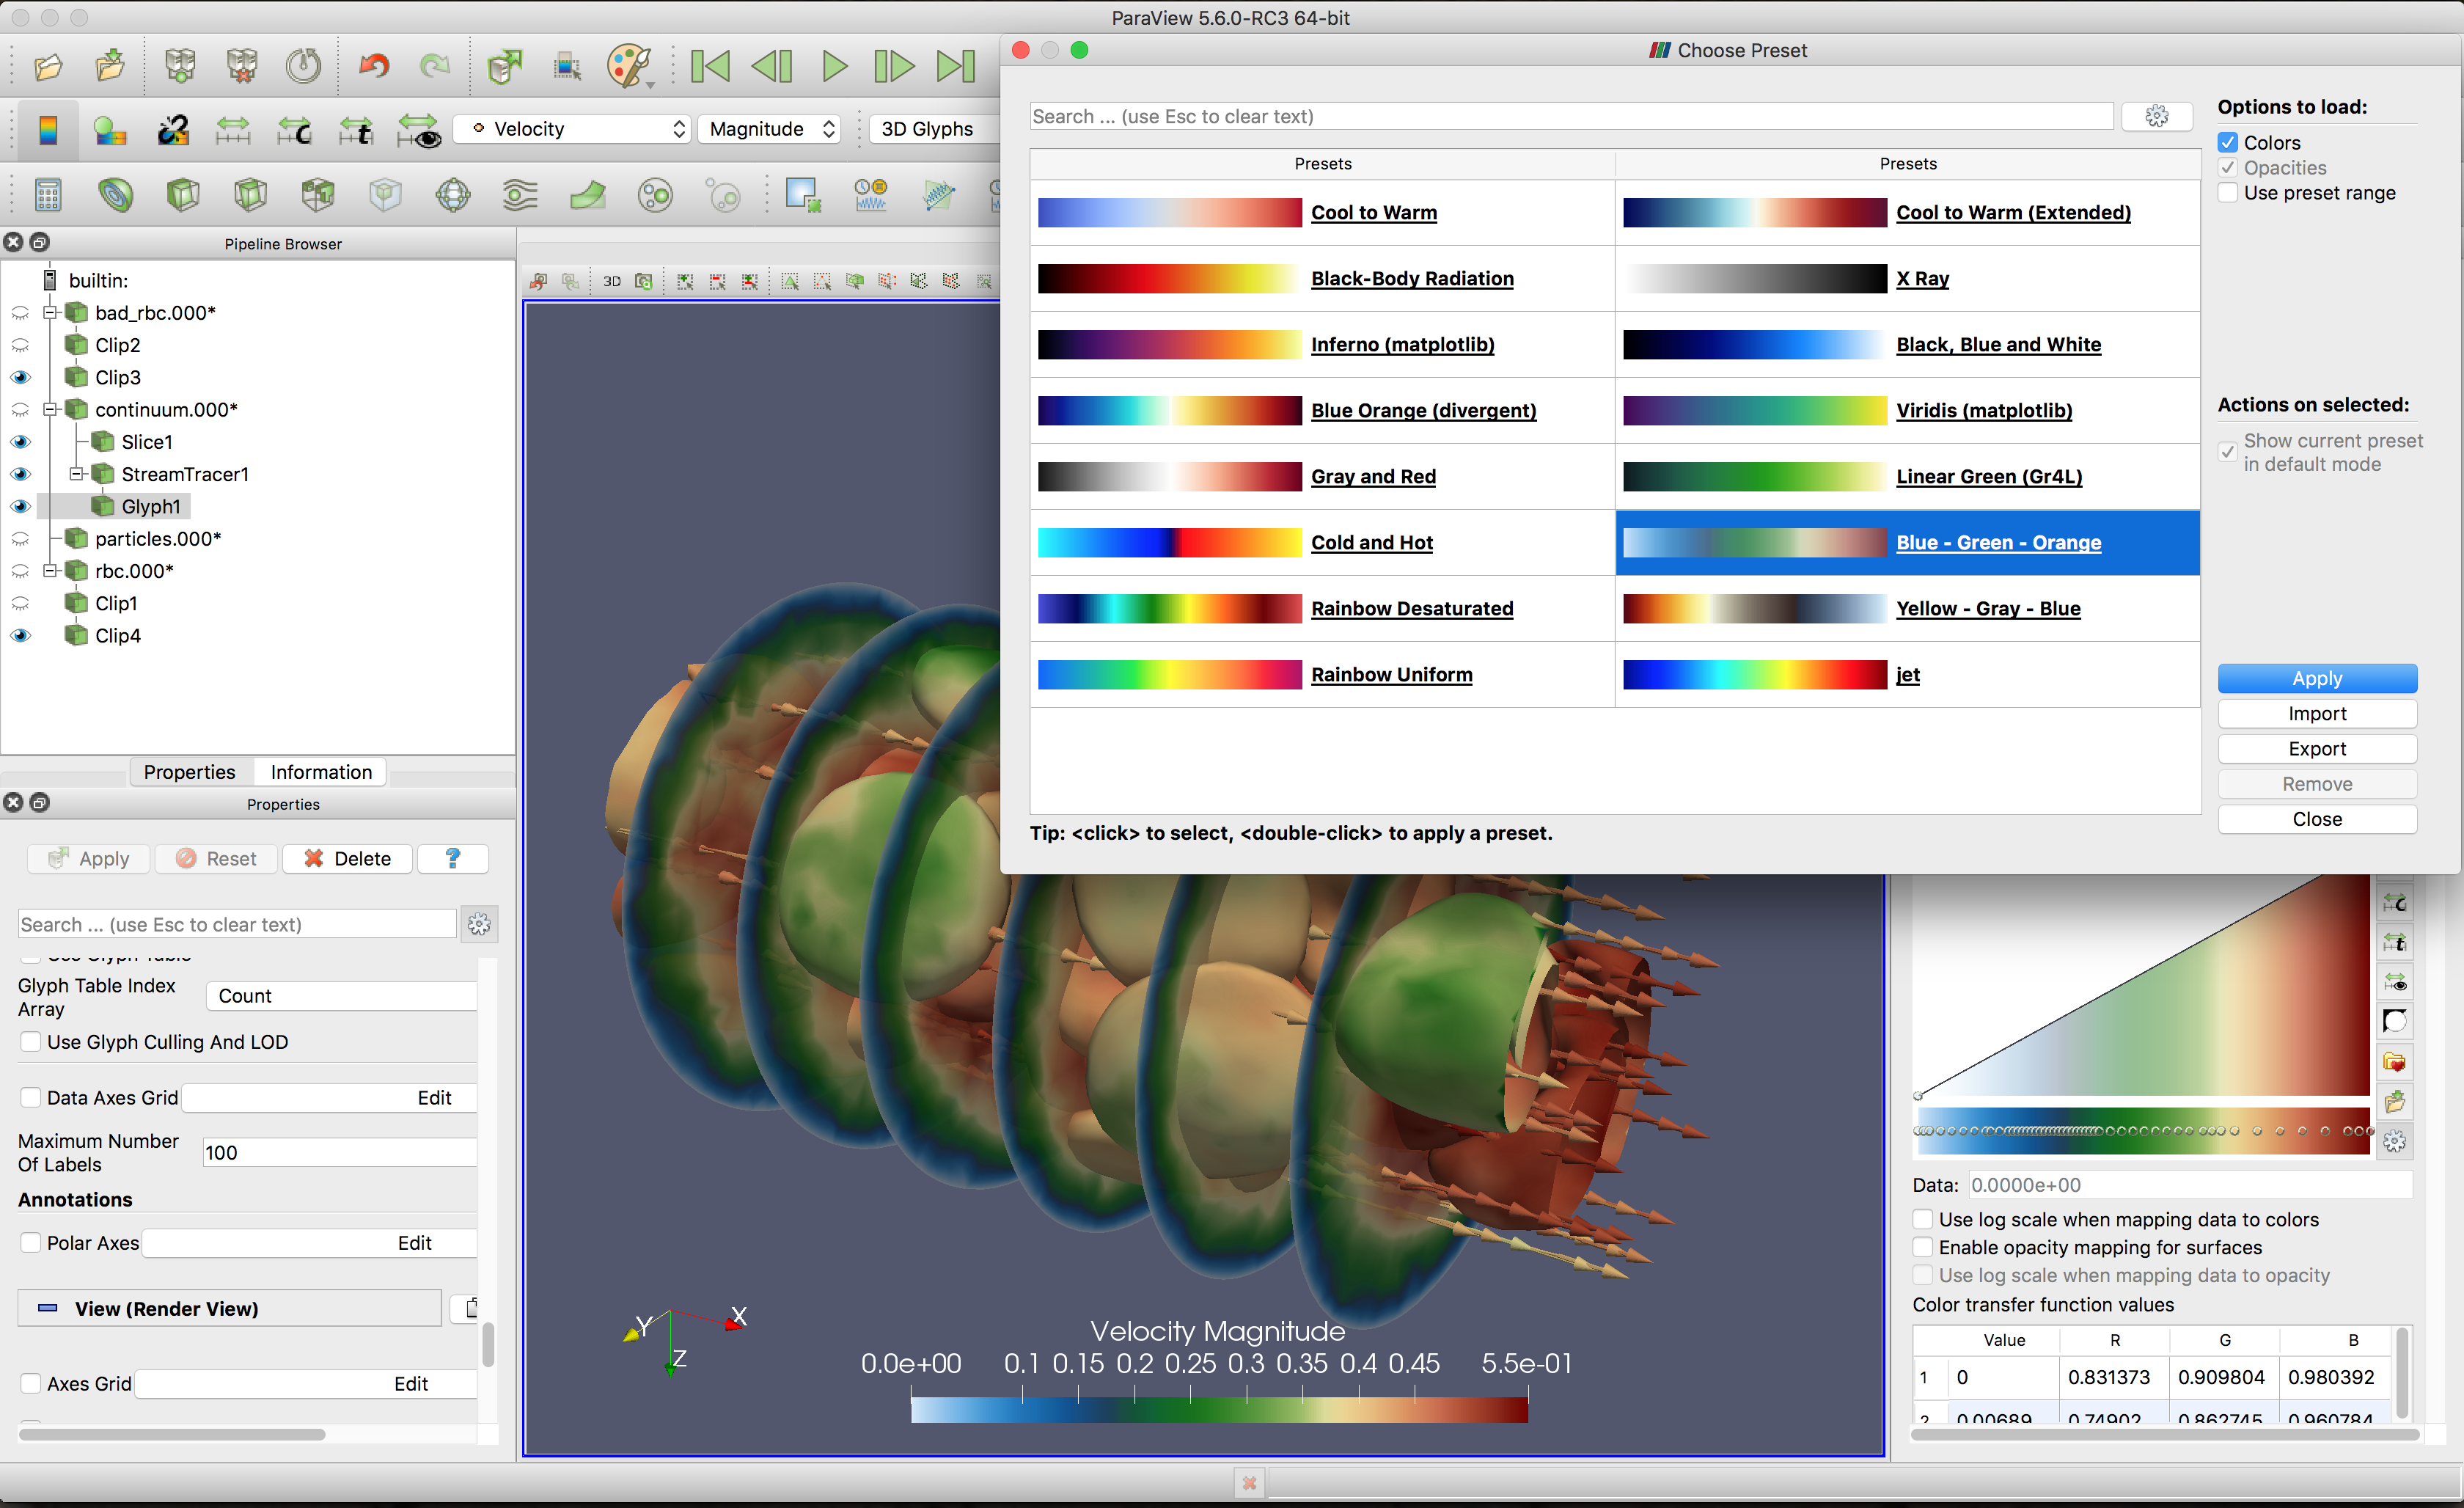
- A more organized presentation of color map presets offers a set of over 15 color maps that visualization experts have curated. While these color maps appear first, there are 188 color maps overall in ParaView.
- Two new settings control the format and precision of real number property values in the client user interface.
Data Ingestion and Export Capabilities
- ParaView reads more types of files in the .series JSON meta format. These files identify values for time steps.
- A new reader supports SEG-Y files that contain geophysical data.
- A new reader supports Gmsh files of higher-order polynomials.
- A new writer (CGNSWriter) records structured, unstructured and polygonal datasets.
- Improvements to the Wavefront OBJ reader allow users to remove groups of sub-geometries.
New Filters for Molecular Datasets
- The Convert Into Molecule filter changes a point set to a molecular dataset.
- The Molecule To Lines filter turns a molecule into a mesh.
- The Append Molecule filter combines molecules.
- The Compute Molecule Bonds filter adds bonds to molecules.
- The Distribute Points filter partitions point datasets among distributed memory processes using the Message Passing Interface (MPI).
Additional Updates
- ParaView supports Python 3.7.
- Users can write plugins for filters, readers and writers as pure Python files with decorators that specify controls in the user interface.
- The new Glyph filter lets users more directly select an orientation array, which determines the direction glyphs face, and/or a scalar array, which determines the size of glyphs.
- The Properties, Multi-block Inspector and Information widgets have new options for editing lists and trees. Multi-block Inspector, for example, can alter the color and opacity of several list items simultaneously.
- The Aggregate Dataset filter is compatible with image data, rectilinear grids and structured grids.
- A new representation, Feature Edges, renders the outline of shapes in data instead of the bounding boxes around shapes.
- The Bounding Ruler filter measures major, medium and minor axes. These axes may better suit arbitrarily oriented datasets than the X, Y and Z axes.
- The Catalyst Export Inspector panel defines and exports ParaView Catalyst scripts. The panel has more options for exporting scripts, such as adding them to a directory.
Forty developers committed changes to ParaView 5.6. Kitware posted release notes on GitLab and on its blog. The company also announced the release on the ParaView Discourse forum, which replaced the mailing lists. In addition to announcements, the forum includes support questions, notes about plugins and applications, tips and information on hiring at Kitware. Kitware currently has open positions on its HPC and visualization team, including scientific visualization developer. Developers who want to work on ParaView at Kitware can apply to job postings on https://jobs.kitware.com.
As Kitware hinted on its blog, ParaView 5.7 will improve spatio-temporal parallelism to more quickly export images and geometry from time-varying data, which will help users save time. Version 5.7 will also let users employ the same ParaView session to define the images or geometry they want to export through Catalyst Export Inspector and then run the export itself.
With other updates, ParaView 5.7 will provide a complete solution for hypertree grid datasets. It will also rework ParaView’s CMake-based build system to reduce CMake configuration times and make it easier to use ParaView from other CMake projects. For specifics, please visit Kitware’s booth (3735) at SC18.