
New in ParaView: Color bar placement

Color bars (or scalar bars or color legends) are corner stones of any effective visualization. While users could always show and place color bars in the visualization, visibility and placement of color bars was always user driven. You always had to show color bars manually and place them appropriately. Improvements landing in ParaView development repository soon include an overhaul to this logic. You can now tell ParaView to automatically show color bars when coloring with an array. ParaView will also attempt to layout color bars in the view to avoid overlap.
Settings
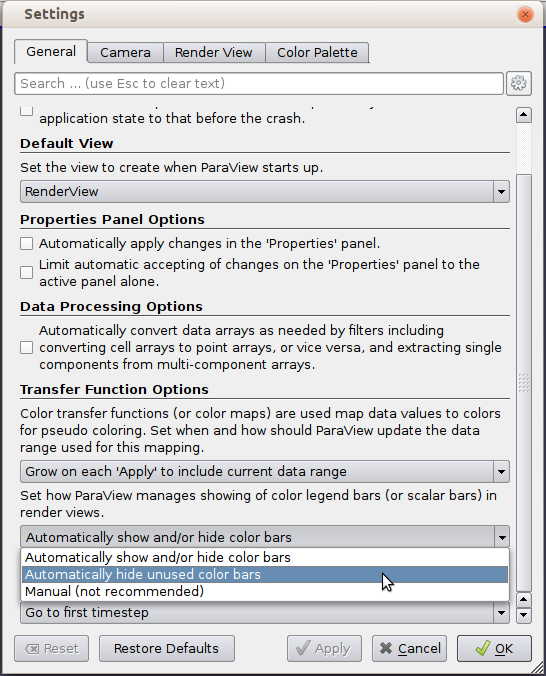
The Settings dialog, on the General tab, allows you to pick the mode to control color bar visibility. When Automaically show and/or hide color bars is selected (default), ParaView will show or hide color bars as needed whenever scalar coloring is employed in the visualization e.g. when you apply a new filter such as Calculator and ParaView decides to color by the Result array, you will automatically see the color bar for Result array in the view as well. Same is true when you pick a array to color with using the toolbar or Properties panel.
Select Automatically hide unused color bars to preserve behavior from previous ParaView versions, where color bars are never shown automatically, but may be hidden when no visible dataset is being colored using the particular color transfer function.
Color bar placement
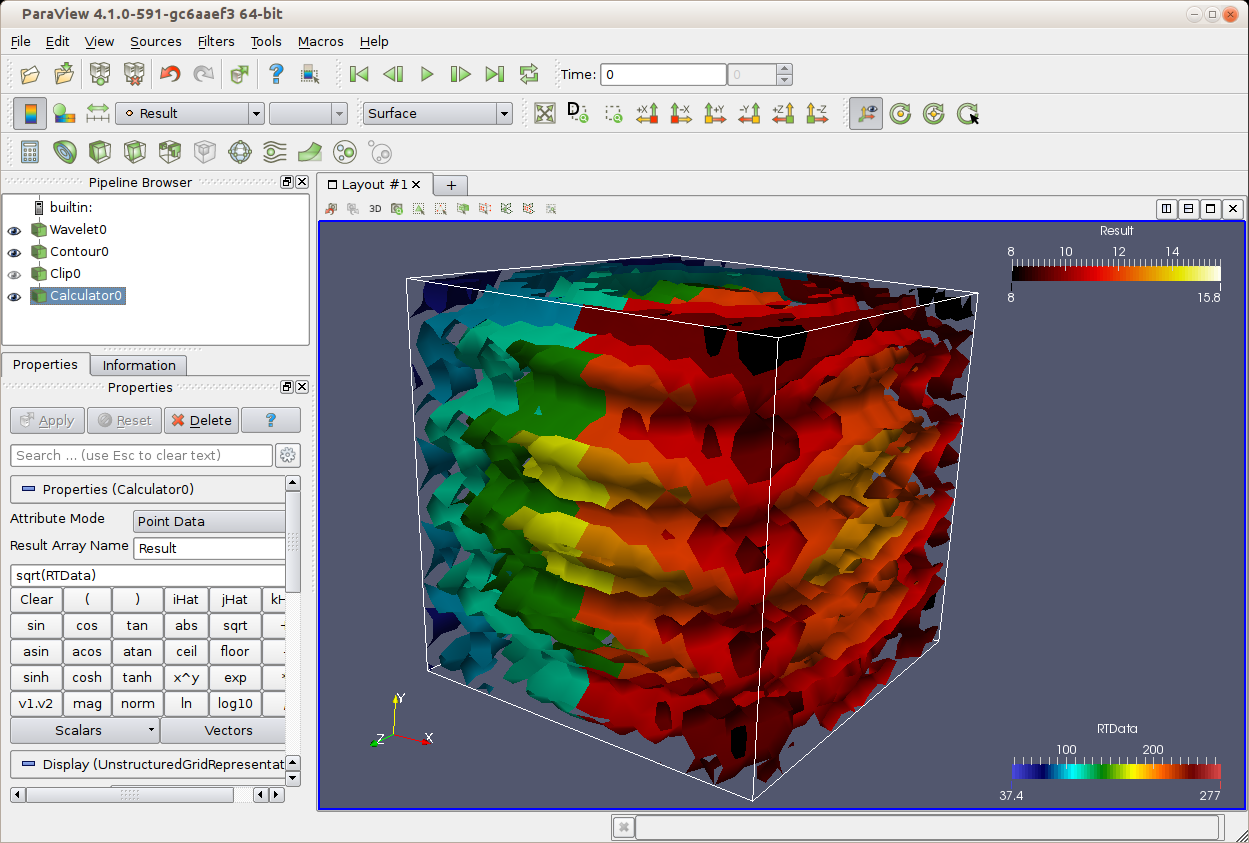
Irrespective of whether the color bar is shown automatically or manually, ParaView will check if the position for that color bar is already in use by some other color bar. If so, ParaView will pick another unused corner to place the color bar in. Currently, there's only one strategy used to place these color bar — arond the periphery of the view. In future we can add other strategies and allow you to pick appropriate strategy from the Settings dialog.