New in ParaView: Histogram View

Newly added to ParaView (and slated to be included in the upcoming ParaView 4.2 release) is a brand new Histogram View. Histograms are nothing new to ParaView. Using the Histogram filter and plotting the results in a Bar Chart View, you could always look at histograms for data arrays. What was lacking was the ablility to then select bins in this histogram and see which data elements those corresponded to.
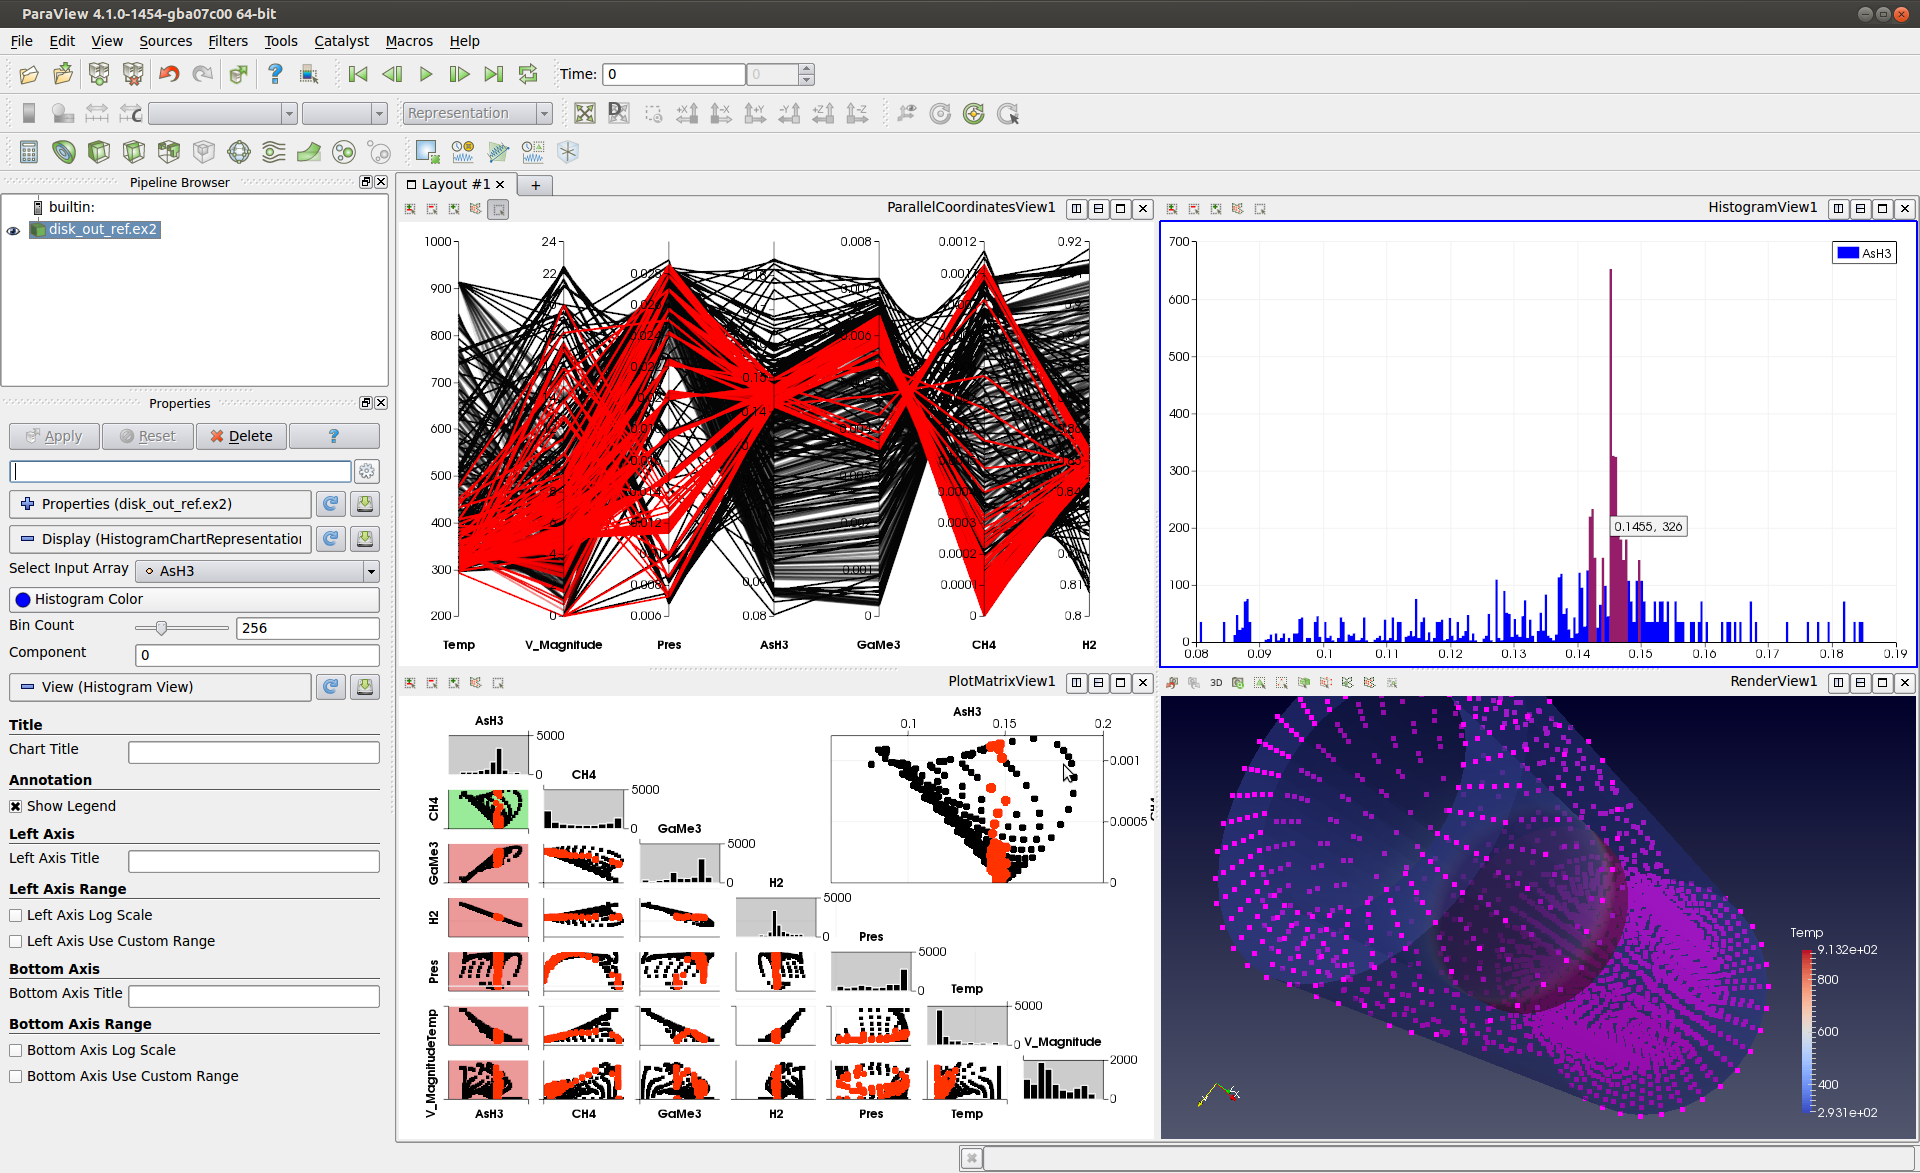
To support this, we added a new Histogram View. You can show any arbitrary dataset, without the need for apply the Histogram filter in this view. The view will automatically show the histogram for the selected data array (which you can select using the Properties panel). These histogram parameters are now available under the Display section.
Using the selection buttons at the top of the view (or the S key), you can enter selection mode and then click-and-drag to select bins in this view. The selection should then reflect in all other views showing the same dataset including Render View, Plot Matrix View, Parallel Coordinates View, and SpreadSheet View.
This looks great, glad to see linked selections getting some attention!