Search for Kitware Gives Back
Courses in Image Analysis that use ITK
April 24, 2018
Post last updated: October 24th, 2019. The Insight Toolkit (ITK) is not only a foundation for the practice of image analysis in industry and academia; ITK has been studied and used to demonstrate principles of scientific and medical image analysis in many university courses around the world. If you are not able to attend Kitware’s […]
ParaView 5.5.0 Release Notes
April 9, 2018
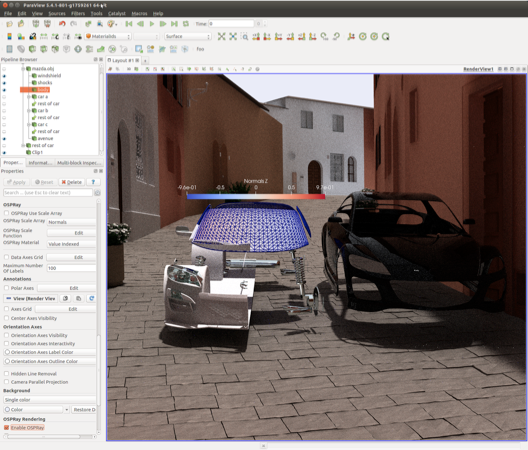
ParaView 5.5.0 is now available for download. The full list of issues addressed by this release is available here. Major changes made since ParaView 5.4.1 include the following: Rendering Enhancements More updates to OSPRay ray traced rendering ParaView’s Ray Traced Rendering capacity continues to evolve. In this release we’ve updated to a new version of […]
Developing Casting Simulations in CMB
December 22, 2017
There is no question that numerical simulation tools have produced a wide range of benefits in the area of modeling and analysis, especially when coupled with high performance computational (HPC) systems. However, the complicated workflow involved in defining a numerical simulation requires a broad understanding of simulation codes and how to use them. Between defining […]

Integration of ParaView Catalyst with Regional Earth System Model
September 21, 2017
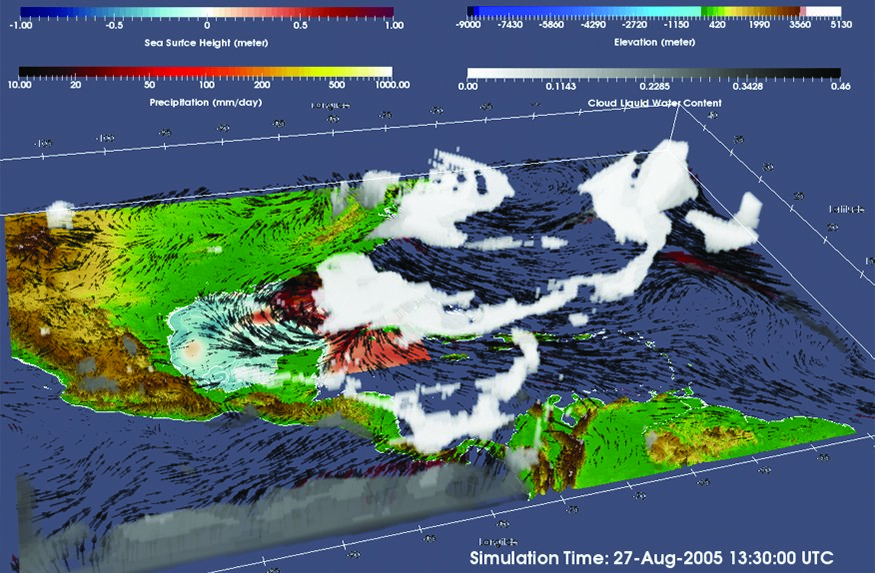
Fully coupled multi-component and multi-scale modeling systems such as Regional Earth System Model (RegESM) are used to represent and analyze complex interactions among physical processes. A typical application of RegESM can produce tens of terabytes of raw data. This data determines the resolution of the spatial grid, the length of the simulation and the number […]
VeloView: Lidar SLAM capabilities
July 4, 2017
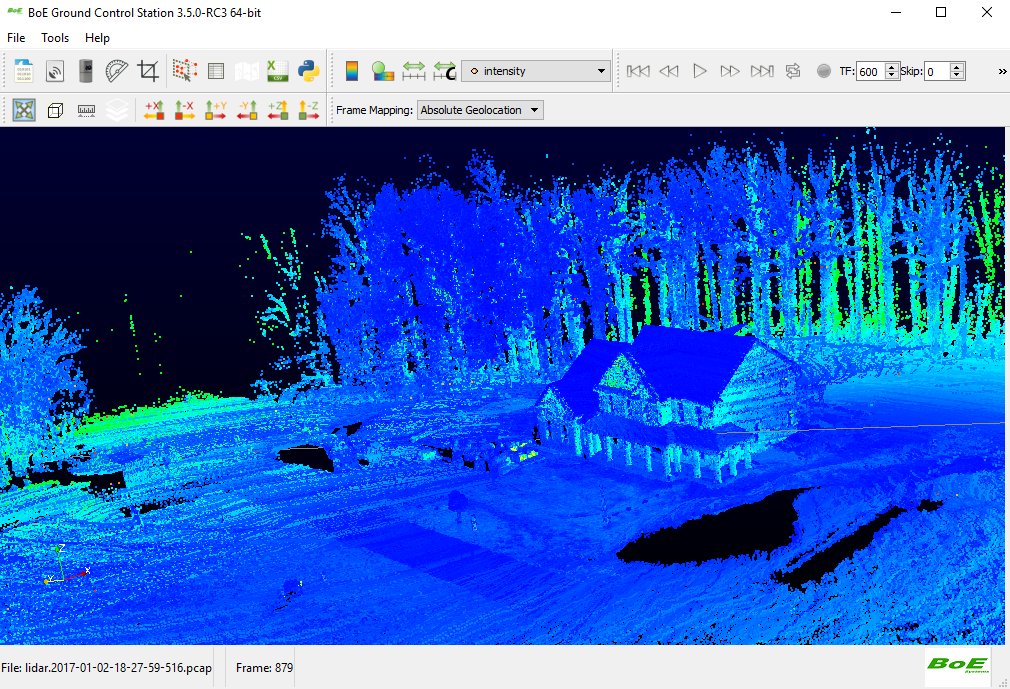
BoE Systems and Kitware demonstrate capabilities of SLAM algorithms for LiDARs mounted on UAVs or other vehicles Kitware and BoE Systems are pleased to present the results of Simultaneous Localization And Mapping (SLAM) features embedded into BoE Ground Control Station (BoE GCS). BoE GCS is the VeloView-based software that displays – onsite – scan 3D results and […]
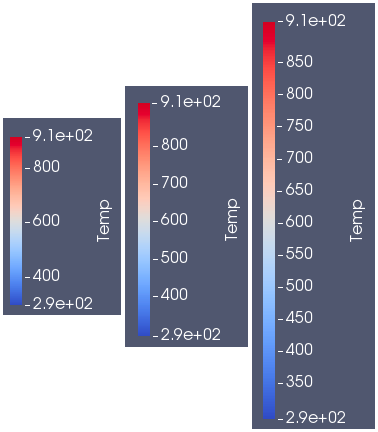
Pseudo-coloring of surfaces and volumes is one of ParaView’s primary methods of displaying data. ParaView’s color legend provides an important link between color and data values, and is a critical component of many visualizations. Over the years, ParaView’s color legend features have expanded to cover numerous usage scenarios, including annotating specific values with text, showing the […]
GeoJS Draws Better Lines
April 27, 2017
Lines are a basic component of most data visualizations. Lines can convey much more than just edges and connectivity; the color, thickness, and opacity of lines can provide additional information. GeoJS, an open-source library for geospatial and large-scale image visualization, can draw sophisticated lines. The recent version 0.11.0 release made many stylistic and quality improvements […]
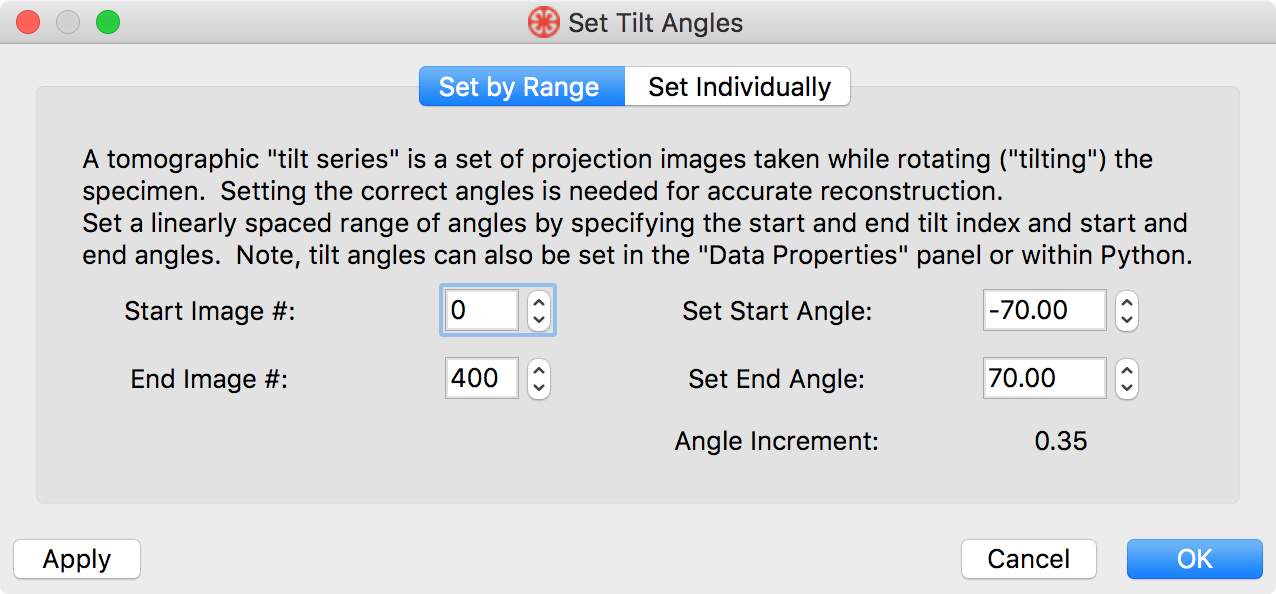
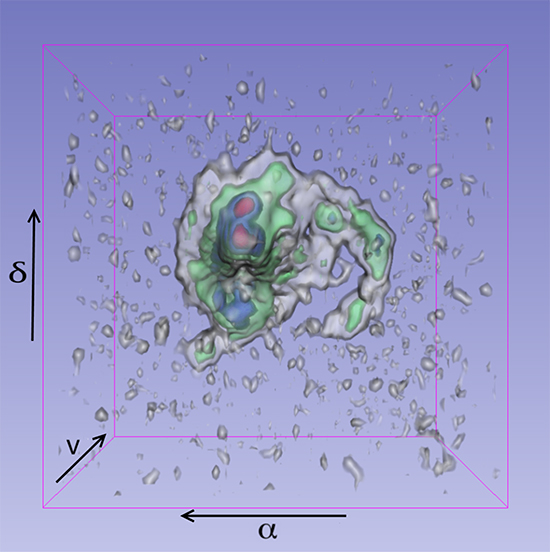
Data Operators in Tomviz
February 17, 2017
A core feature of Tomviz is the ability to modify 3D image data by one or more of the data operators available in the program. These operators can be used to perform 3D reconstruction of raw electron tomography data, to imbue images with metadata, or to perform general 3D image processing and analysis on reconstructed […]
Upcoming neutral hydrogen (HI) surveys will deliver large data sets, in which daily dataflow will reach one terabyte. One of these surveys, Apertif [1], will provide information about HI in and around hundreds of thousands of galaxies. To find and characterize HI objects, automated processing methods must use all of the three-dimensional (3D) information (two […]
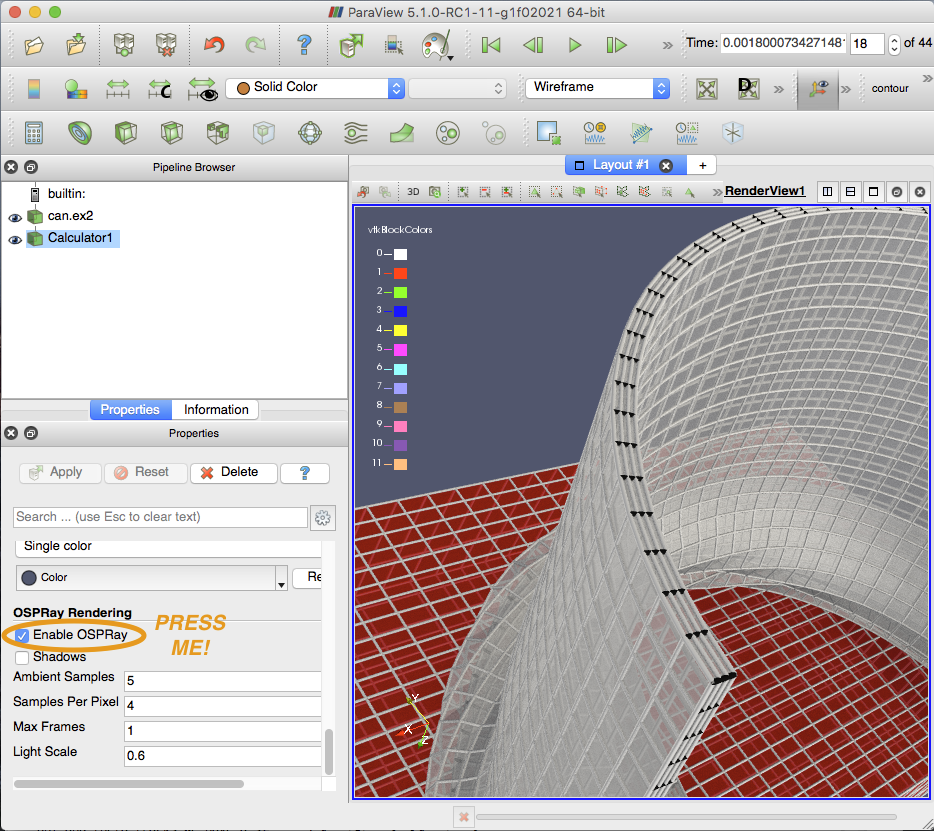
ParaView 5.1.0 Release Notes
June 21, 2016
ParaView 5.1.0 is now available for download. A complete list of issues addressed by this release is available on the bug tracer. Some of the major highlights of this release are as follows: OSPRay ParaView now comes with a built in ray traced rendering capability. Hit the Enable OSPRay checkbox at the bottom of the […]
ParaView 5: Introducing the Point Gaussian representation
February 5, 2016
A new representation for rendering points, the PointGaussian representation, was recently added to ParaView. It extends the basic GeometryRepresentation as well as the UnstructuredGridRepresentation. To give the PointGaussian representation a try, simply choose “PointGaussian” instead of “Surface” as the representation for an applicable dataset. Once you choose the PointGaussian representation, look for the associated properties in the […]
Google of Summer of Code midterm results
August 13, 2015
The students in VTK's Google summer of code program are well on their way to being transformed into polished open source developers. With the help of their mentors all six of the students selected in the highly competative proposal process have passed their midterm evaluations. There are a little bit less than two weeks left in the […]
Simple, Parallel Computing with vtkSMPTools
June 12, 2015
Introduction The Visualization Toolkit system has been in active development for over twenty years, and from the earliest days the community has concerned itself with parallel computing. The class vtkMultiThreader was introduced in 1997, mainly to support threaded, shared-memory data processing in the imaging pipeline. Scalable, distributed parallel computing has also been a major focus. […]
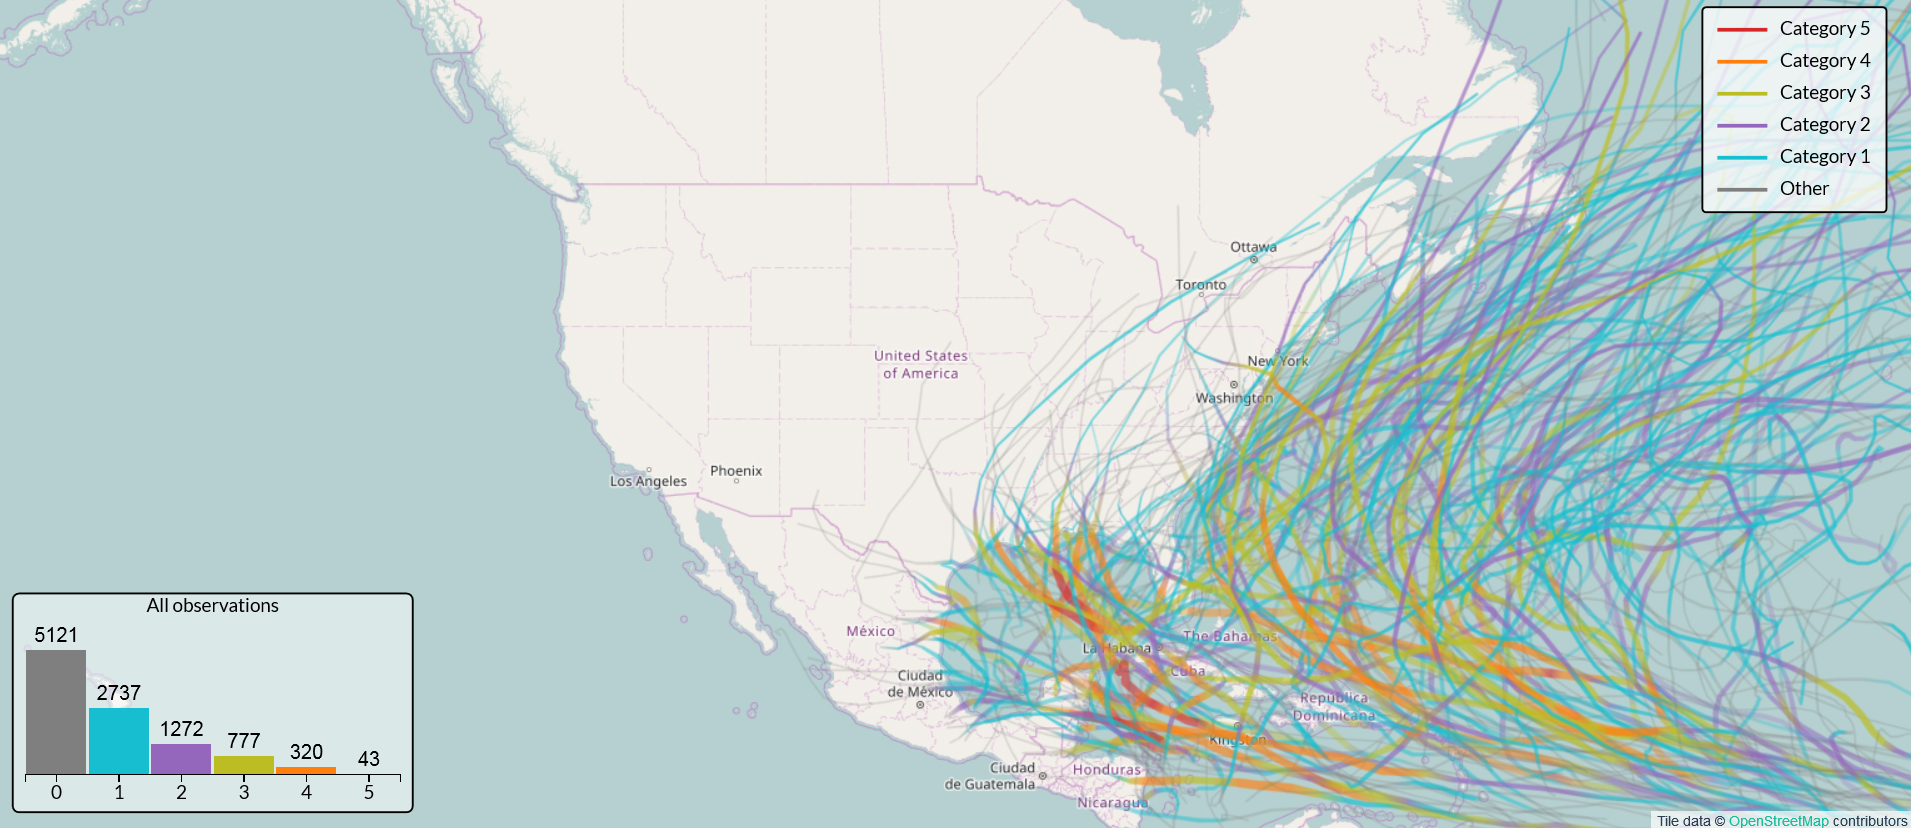
ClimatePipes: Hurricane Path Explorer using GeoJS
February 26, 2015
Back in October, we have introduced GeoJS, a library for web-enabled geospatial analysis and visualization, along with an overview of the feature API. Since then, we have been hard at work improving the core API, adding features, and writing documentation. Among the new features added includes: vector and polygon features, a simple per marker styling API, […]
Introducing Tangelo
January 30, 2015
Over the past two years, we have been developing Tangelo [1] in the pursuit of rich web applications for solving problems, both old and new. We recently passed 2,000 commits in the repository [2], and Tangelo will soon be ready for prime time. This article aims to inform you more about the technology with a […]
Introducing Tangelo
December 12, 2014
This article is the first in a series on Tangelo, a Python-supercharged web application framework. Other articles in this series: Part 2: The Beauty of Simplicity Over the past two years, we have spent much of our time developing Tangelo [1] in the pursuit of rich web applications for solving problems both old and new. We recently passed 2000 commits […]
VTK’s Second Google Summer of Code
October 21, 2014
This year, the Visualization Toolkit (VTK) was accepted to participate as a “mentoring organization” in Google Summer of Code (GSoC). This is VTK’s second time taking part in the program, which fosters student participation in open source communities, encouraging them to immerse themselves in an open-source project for the summer. VTK first participated in GSoC […]