
ParaView 5.7.0 Release Notes
Major changes made since ParaView 5.6.0 are listed in this document. The full list of issues addressed by this release is available here.
General Notes
New CMake Module System
The CMake build sub-system for ParaView has been completely redone and updated to effectively use the latest enhancements in CMake. Following these improvements, developers should see a vast improvement in CMake configure and generate times due to minimizing of the number of generated configuration files that were previously used to track module-related information. Now, all of that information is associated with the targets themselves. Furthermore, modules now respect private and public dependencies between modules including propagation of include paths. That improves build times as it avoids leaking include paths and minimizes potential for private includes from clobbering other modules. Please be advised that these changes have resulted in changes to available CMake options when building ParaView Read more….
Guidelines for updating ParaView plugins and ParaView-based applications will be enumerated in a future transition guide document.
Python 3
ParaView has had experimental support for Python 3 for several releases. In this release, we publish Python 3 compatible binaries on www.paraview.org for Windows and Linux. For macOS, we are providing binaries with Python 2 only. We expect that this will be the last ParaView release to include support for Python 2. Starting with 5.8, only Python 3 will be supported and included with the binaries. Making the transition exposed a number of lingering issues that we have addressed in this release. For example ParaView’s Cinema library had to be updated for compatibility with Python 3. Fortunately, most Python scripts generated from ParaView with Python 2 can be ported to Python 3 without much work – many may not require any porting.
Catalyst editions not available in this release
This version of ParaView does not support the building of Catalyst editions. A Catalyst edition-like mechanism that enables selective inclusion of the parts of ParaView needed for in situ analysis will be added to a subsequent version of ParaView.
Updated third-party dependencies
ParaView and VTK depend on a number of open source third-party libraries. ParaView 5.7.0 has the latest known stable versions of third-party libraries. For details and specific version numbers of third-party libraries that ParaView now depends on, please see the list of updates in VTK and ParaView.
Enabling rendering with Mesa
In the linux binaries, the way to use the bundled Mesa libraries for rendering has changed. Instead of running paraview –mesa-llvm, for example, you now launch ParaView with an auxilliary executable that sets up library paths so that Mesa is used, e.g.,
> paraview-mesa paraview --backend llvmpipe
> paraview-mesa pvserver --backend llvmpipe
> paraview-mesa pvbatch --backend swr
Arguments to the ParaView application can be passed with
> paraview-mesa pvserver --backend llvmpipe -- --server-port=22222
To see all the backends available, run
> paraview-mesa --help
New Features
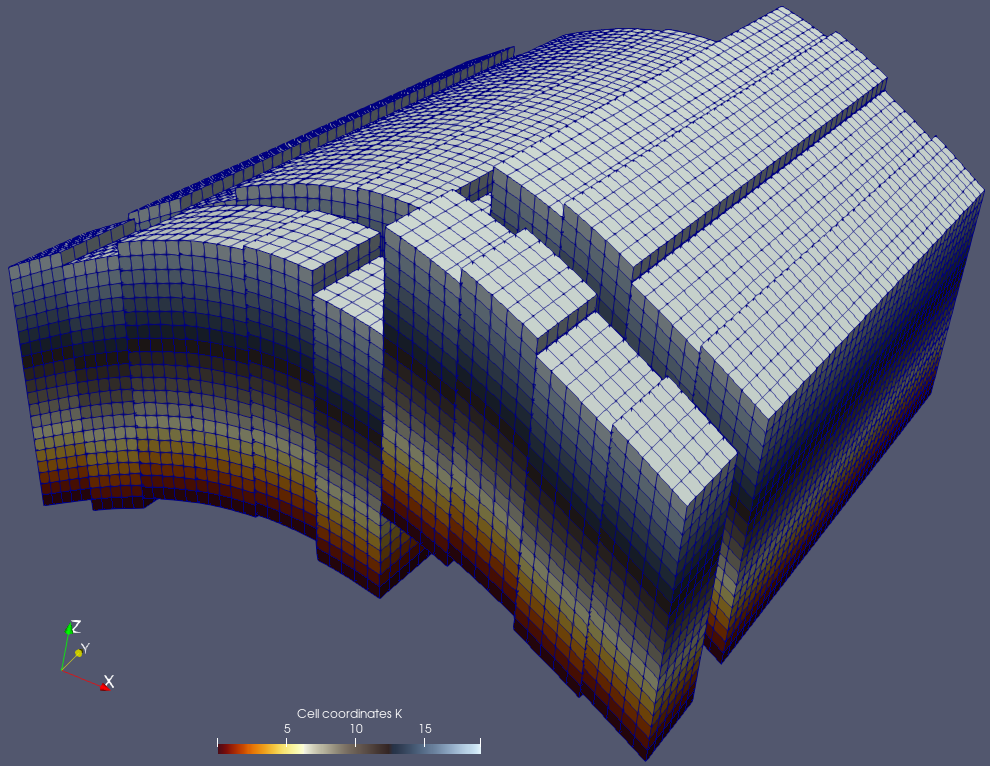
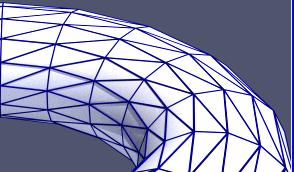
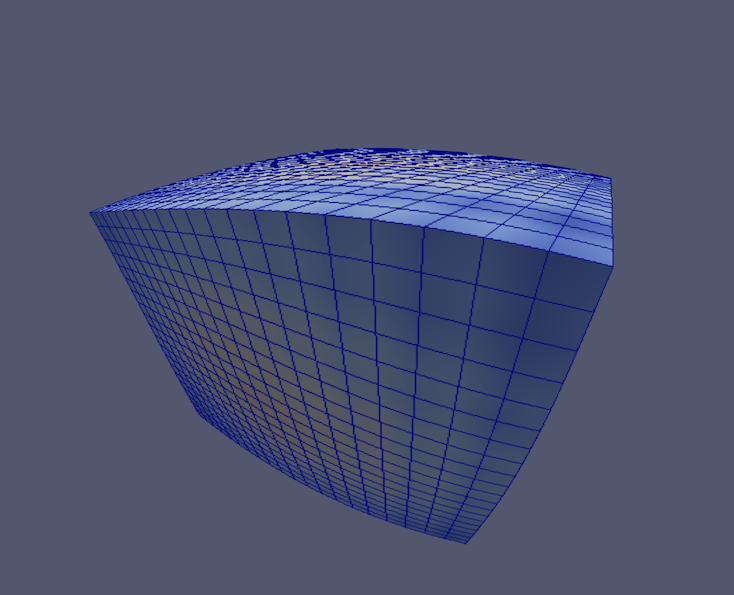
Plugin for Explicit Structured Grid datasets
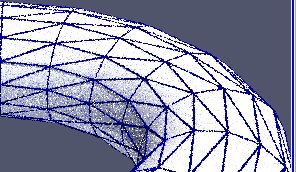
Explicit structured grids have recently been introduced in ParaView. These grids allow definition of a dataset where cells are topologically structured (all cells are hexahedrons and structured in i, j and k directions) but have explicit definitions of their geometry. This dataset enables representation of geological or reservoir grids, for instance, where faults can exist in any direction.
ParaView can now render explicit structured grids. The ExplicitStructuredGrid plugin exposes a source and a set of filters provided to generate such grids, convert to/from Unstructured Grids, and efficiently slice and crop those grids.
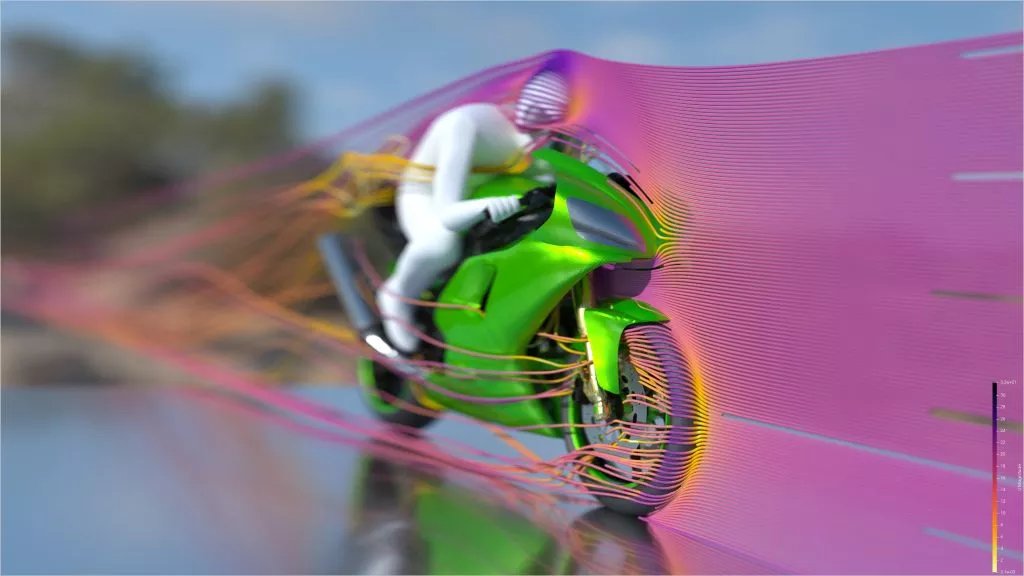
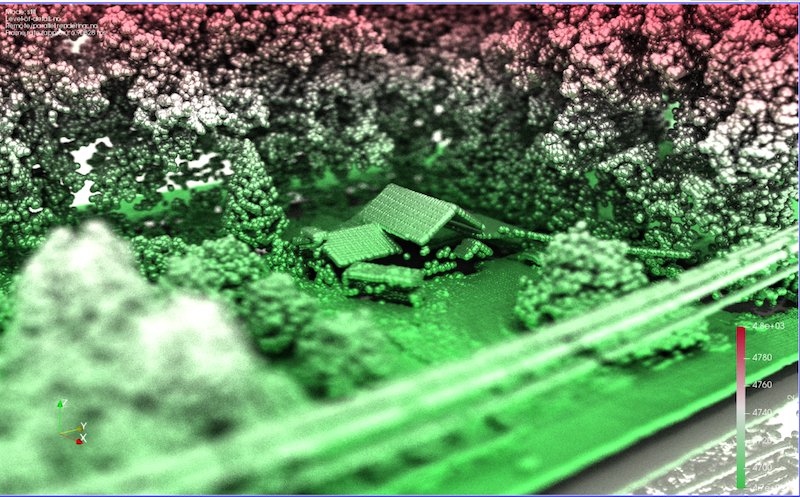
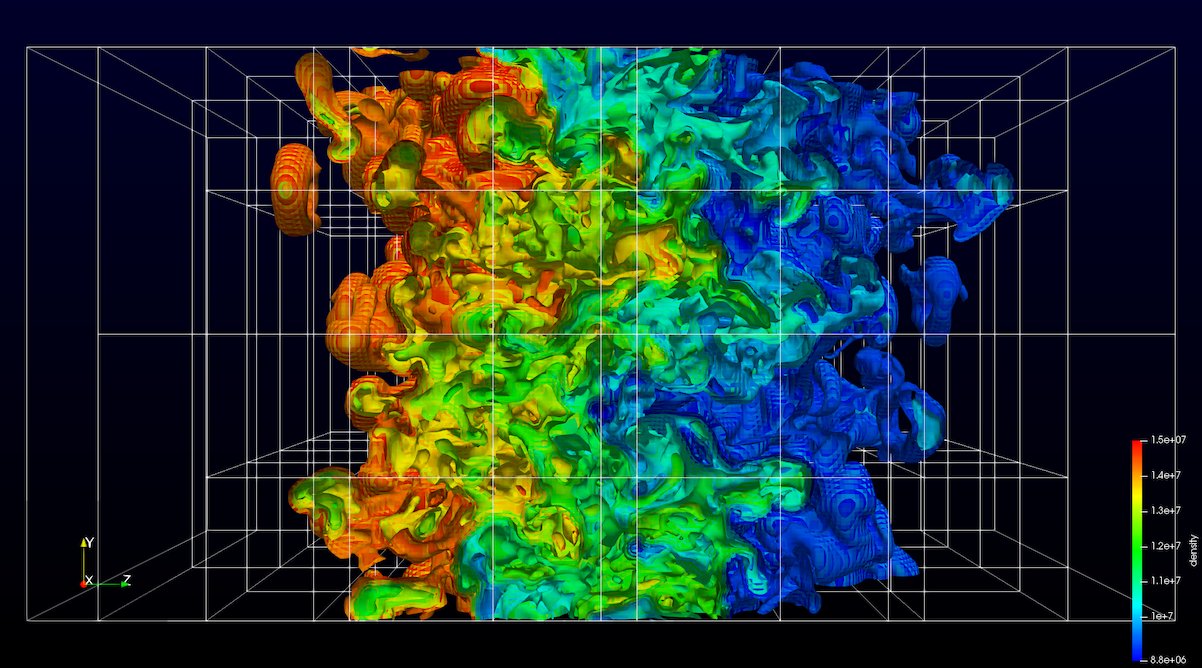
ParaView and VTK add GPU-accelerated ray tracing with NVIDIA RTX
ParaView now includes seamless support for hardware-accelerated ray tracing using OptiX, a component of the NVIDIA RTX platform.
Accelerated by the latest-generation GPUs, especially with the RT Cores devoted to ray tracing found on NVIDIA’s Turing GPUs, ParaView brings a wide range of benefits to scientific visualization. Far beyond making pretty pictures for publication and outreach, the resulting photo-realism can in some cases be used for direct comparisons between simulation output and observations.
In other cases, the visual cues obtained by the physically based rendering process, including shadows, ambient occlusion, or even depth-of-field effects, can help to better understand the spatial relationship of the objects in the scene. This visual fidelity comes with a significant computational cost, but modern GPUs make it possible to perform this process in real time. Read more…
New Export Inspector
The Catalyst Export Inspector panel has been expanded in this release and renamed Export Inspector. Besides exporting Catalyst scripts, it now acts as a central place to define outputs generally. That is, not only does it replace the Temporal Parallelism Batch Script Generator plugin, but you can also now use it to set up automated screenshots, data exports and full Cinema databases within an interactive GUI session. To use it to configure the screenshots and data writers that you want in the panel, first optionally define output frequencies, then select either Export Catalyst Script, Export Temporal Script or Export Now items from the Catalyst menu. If you are in an interactive session with time varying data and choose Export Now, ParaView will animate through the timesteps and write out the file that you have configured. Exporting scenes to Cinema databases (*.cdb) through the File > Export Scene… menu option has been removed and we expect to remove more of the GUI sections and code paths that predated the unified inspector panel in the next minor ParaView release (5.8).
Generating warning/information/error logs
ParaView now supports generating logs with varying levels of verbosity to help debug and track down performance bottlenecks.
Messages are logged at varying verbosity levels and include a timestamp from the start of the program to provide timing information. To make ParaView show log messages at all levels lower than a specific value in the range [-2, 9], use the -v=[level] command line option, where -2 is used for errors, -1 for warnings, 0 for info, and 9 for trace.
One can request log messages to be logged to files instead using -l=<filename>,<verbosity> command line option. Multiple -l options can be provided to generate multiple log files with different verbosities, if needed.
When logging messages, ParaView logs messages in several categories, and provides the ability to elevate the logging level for any specific category using environment variables. By elevating the level for a specific category, e.g., PARAVIEW_LOG_RENDERING_VERBOSITY to 0 or INFO, one can start seeing those messages on the terminal by default without having to change the stderr verbosity. This feature is useful for reducing the number of log messages not related to the chosen category. Read more….
Exporting ParaView scenes to ParaView Glance
With our recent work on vtk.js and ParaView Glance, more exciting options for exporting data are now possible. A refreshed version of the web export feature that provides a vtkjs export of a scene from ParaView is available. In addition, this feature provides an option to embed the exported datasets into a standalone ParaView Glance HTML file. The exported vtkjs and HTML files can be sent to others for viewing and interaction using only a modern web browser. What’s more, the big difference from the WebGL export is that you can use ParaView Glance to adjust the lookup tables, fields to view, representations and even create some cool looking screenshots. Read more…
Support for vtkPartitionedDataSet and vtkPartitionedDataSetCollection
The new VTK composite dataset types vtkPartitionedDataSet and vtkPartitionedDataSetCollection are now able to be read from and written to .vtpd/.vtpc files and can be rendered in ParaView.
vtkPartitionedDataSet and vtkPartitionedDataSetCollection are intended to eventually replace vtkMultiBlockDataSet and vtkMultiPieceDataSet with the goal to make it easier to develop distributed readers and filters that work with composite datasets. In coming releases, we intended to start replacing major vtkMultiBlockDataSet readers to start producing vtkPartitionedDataSetCollection instead.
Rendering enhancements
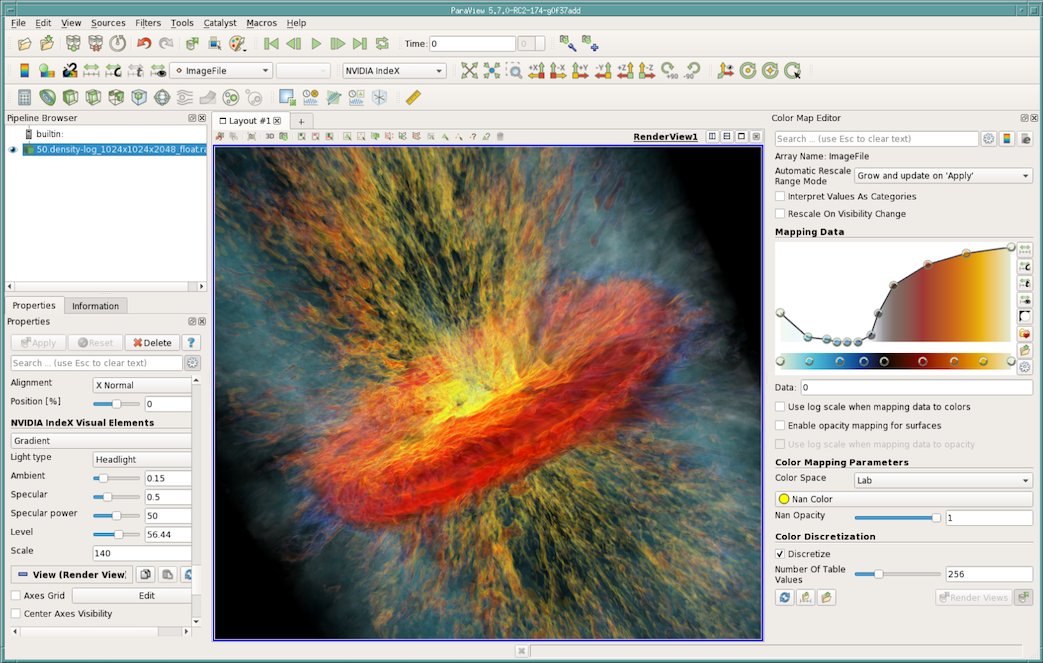
NVIDIA IndeX plugin updated to version 2.3:
The NVIDIA IndeX plugin for accelerated volume rendering has been updated to version 2.3.
New Features
- New global instance of IndeX library is shared among all volume representations.
- Multiple volume support in scene graph (limited to one visible volume at time for current version).
- Added ParaViewWeb support.
- Added basic support for tile rendering when ParaView save screenshots/animations.
- Added support for ParaView’s Scalar Opacity Unit Distance.
Improvements
- Faster startup times for both structured and unstructured volumes meshes.
- Reduced plug-in host memory footprint.
- Logged location of performance values and scene dump outputs.
- Extended information in performance values output.
- Added warning when using datasets with scalar values in double precision.
- Added option to enable pinned staging buffer.
- Disabled rasterizer pre-allocated buffers.
Stability fixes
- Fixed memory leaks when removing a dataset from the scene.
- Fixed issues with time-series and structured volume grids.
- Fixed crash when switching between scalar properties.
- Fixed several issues when interacting with multiple volumes in the same session.
Ray tracing updates
ParaView 5.7 updates its version of OSPRay to 1.8.4 and includes a number of OSPRay-related fixes and improvements. The most impactful is the incorporation of Intel’s Open Image Denoise library version 0.8 which uses Machine Learning techniques to eliminate undersampled speckle artifacts from path traced images much more quickly than they would otherwise be resolved with additional sample rays and/or render passes.

As there are now two ray tracers to choose from, the related GUI controls are now labeled “Ray Tracing” instead of “OSPRay”. If your GPU supports RTX ray tracing, you will find a new ray traced backend option called “OptiX pathtracer” option in the ray traced rendering backend pulldown list.
Both OSPRay and OptiX benefit from two noteworthy new features. The first is that the ray traced render cache, which accelerates video playback, has been expanded beyond volume rendering to speed up surface rendering as well. The second was the addition of camera depth of field controls to the “Adjust Camera” dialog that let you produce images that, like in a photograph, are crisp at the focal point but blurred up to and beyond it.
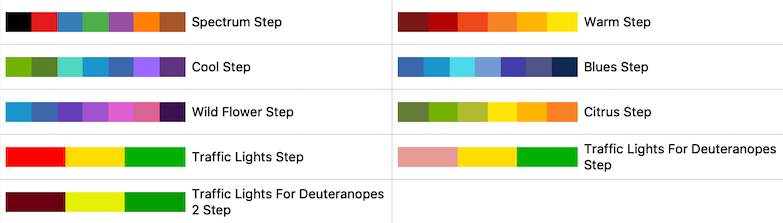
Step color space
The “Step” color space option in the Color Map Editor enables creation of step color map functions, where the color of each interval corresponds to the color of the second point of the interval.
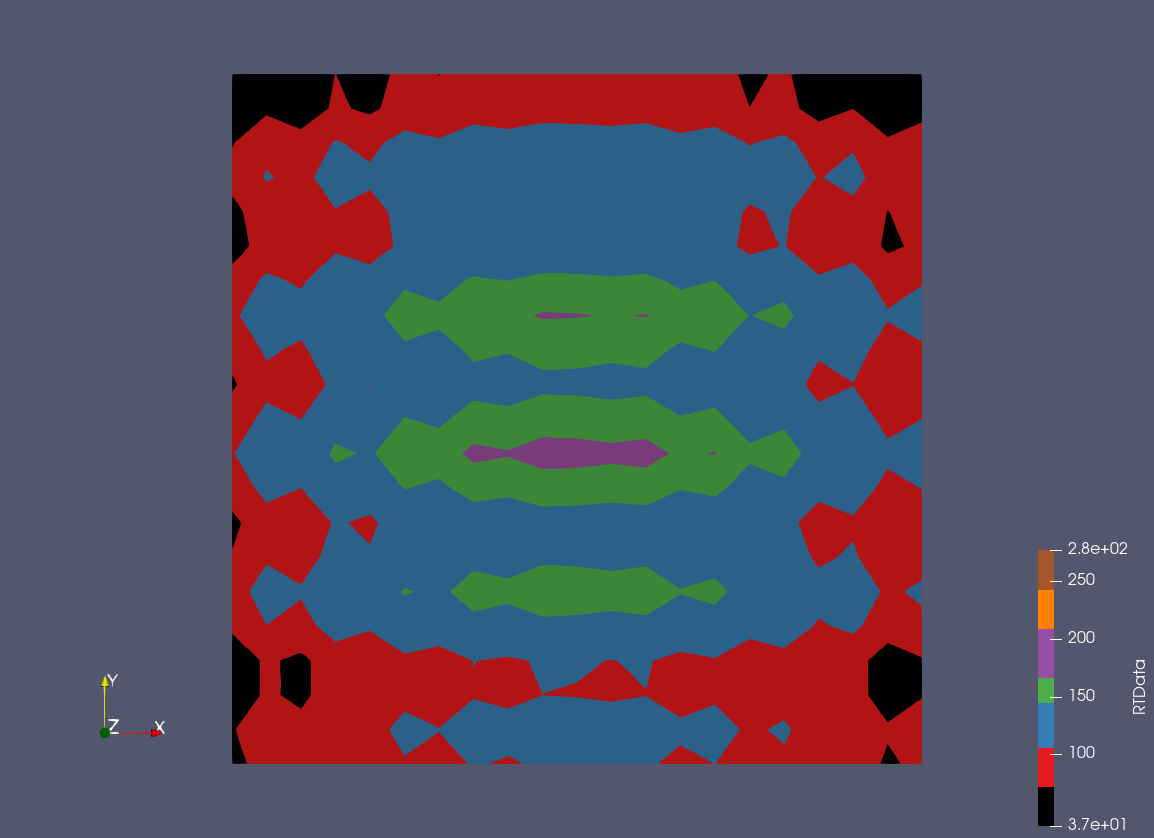
ParaView comes with a few presets for the “Step” color space based on the existing indexed color maps. They are accessible through the Choose Preset dialog.
Default coincident topology resolution has changed
The method used to resolve coincident topology such as lines on surfaces has been changed to “Offset faces relative to lines and points”. This method does not suffer from the same problems with lines appearing to float above surfaces that were present in some zoomed-in views with the previous default method “Shift z-buffer when rendering lines and points”. The default offset parameters have been adjusted to be good for a wide variety of datasets bounding box sizes.
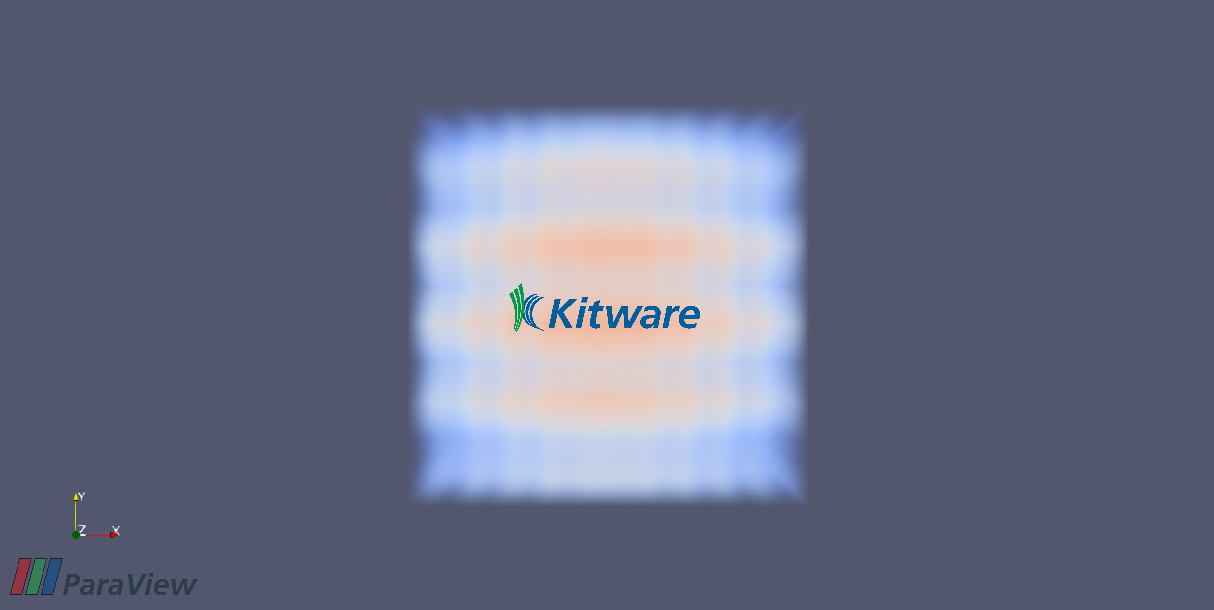
Logo source
A new Logo source has been added. The source enables you to load an 2D RGBA image as a texture and show it projected on the foreground of the rendering plane. Its size, position and opacity can be changed interactively. This source enables you to display the logo of your institution on the images and videos generated with ParaView.
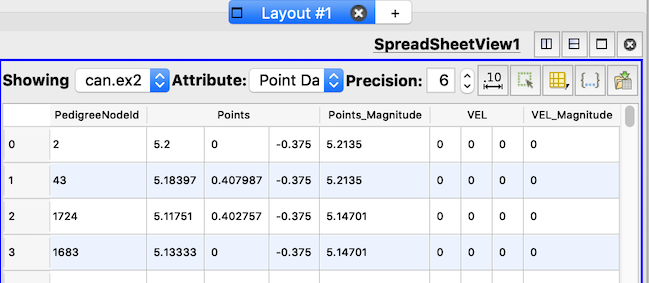
Improvements to viewing multi-component arrays in the Spreadsheet view
The SpreadSheet view can now show multi-component arrays as multi-columns with a joined header. Individual component columns are still user-resizable, just like any other column.
Panoramic projection plugin
Add a new plugin that enables a new render view type called the Panoramic Projection view. This new render view projects the current scene in order to capture the scene up to 360 degrees. Images produced from this view can be used as input for specific devices like VR headsets, domes or panoramic screens.
Two projection types are available:
- Equirectangular projection (usual world map projection)
- Azimuthal equidistant projection (fisheye projection)
Point Gaussian representation improvements
Improvements include:
- Better default configuration now managed by the domain
- Multiple corrections to the widget/dialog duality
- Bug with multiblock datasets in client/server mode has been resolved
Better default AVI codec for Windows
The default codec for saving animation videos on Windows has been changed to I420. Furthermore, you can override the FOURCC code using the save animation dialog to choose a better codec available on your system.
Abort animation saving
When saving animations, you can now abort the saving of animation using a popup dialog. Thus, you can cancel animations that are not progressing as expected rather than having to wait for the export to complete.
Filter changes
Faster contouring and slicing for datasets with only linear cells
For certain inputs, the Contour filter delegates operation to a filter optimized for this type of dataset. The input dataset must meet the following conditions for this filter to be used:
- All cells in the input are linear (i.e., not higher order)
- The contour array is of type int, unsigned int, float, or double
- The Compute Scalars option is off
In addition, if a dataset has linear cells only and the cut function requested is a plane, the Slice filter will delegate the slice generation to an optimized algorithm for slicing. If the Crinkle Cut option is enabled, a faster algorithm for linear cells is used for all cut functions.
Threshold filter has new Invert option
The Threshold filter usually extracts cells that fall within lower and upper bounds of a data array. A new Invert option instead causes it to extract cells outside the lower and upper bounds.
HyperTreeGrid implementation details
Work on expanding ParaView’s tree based AMR data model has continued in this release. The largest change is that VTK’s vtkHyperTreeGrid dataset type is no longer accepted by a majority of ParaView’s vtkDataSet processing filters. This feature was removed because the underlying implicit conversion to vtkUnstructuredGrid happened too often and consumed so much memory that there was little or no benefit to using the data structure. Instead, ParaView now always stays with the memory conserving AMR representation except when you explicitly ask for a conversion via one of the two explicit type conversion filters, HyperTreeGrid to Dual Grid, and HyperTreeGrid to UnstructuredGrid.
In simple test cases memory consumption dropped with this change from 6.6 GB down to 51 MB. There were a number of other changes and improvements in this release, especially to the format of the relatively young .htg file formats as well. The file format changed to split up the serialized node representation into a set of grids that better support distributed memory parallelism.
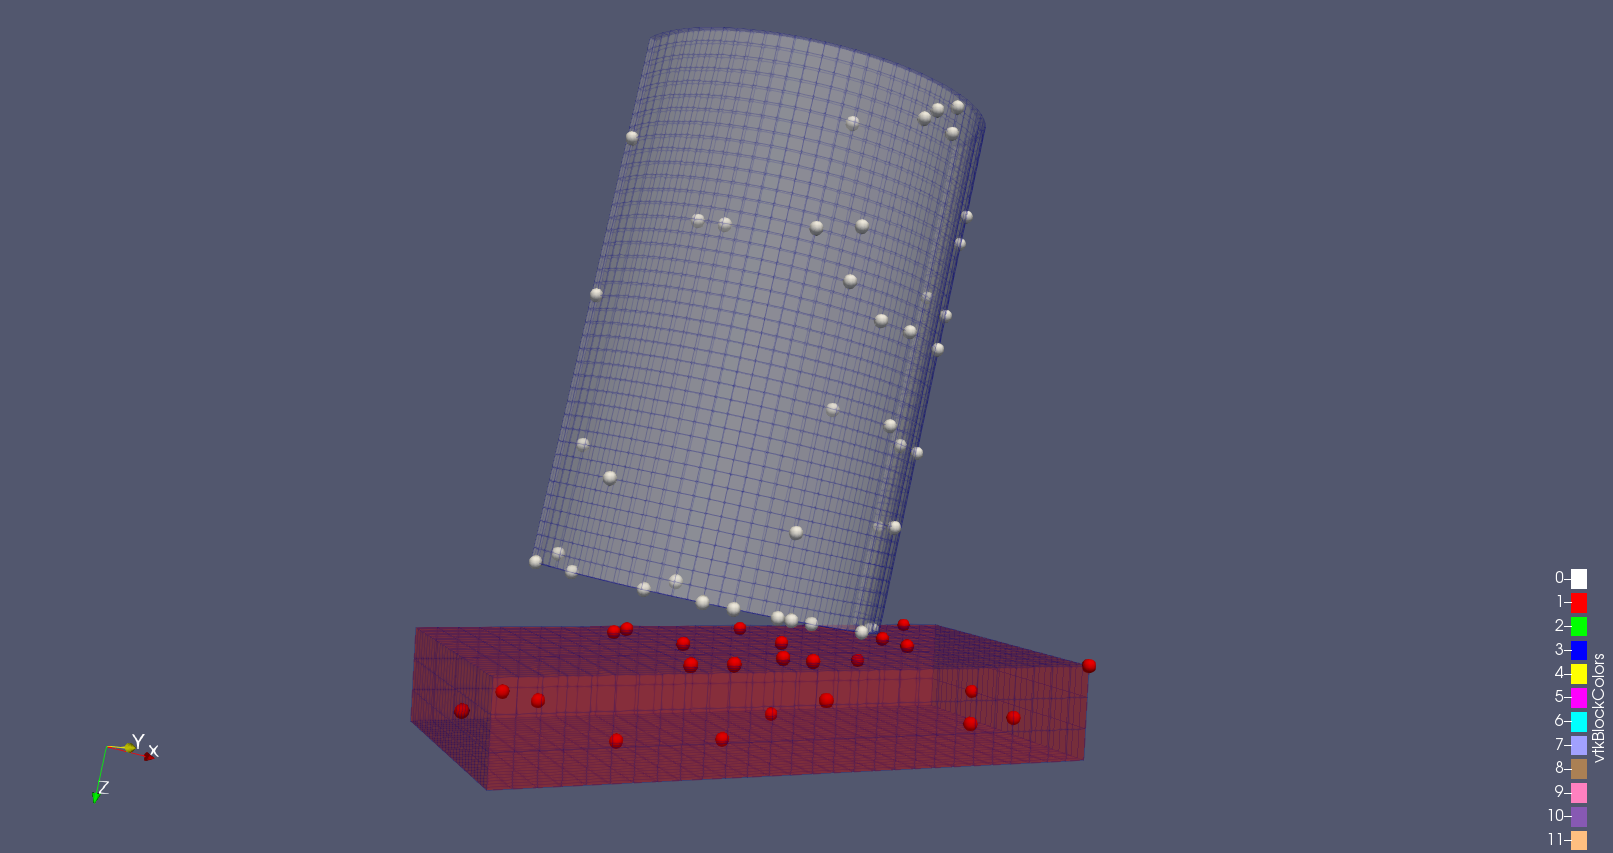
Two new uniform inverse transform sampling modes in Glyph filter
Two new uniform glyphing modes based on the “inverse transform sampling” algorithm were added to the Glyph filter to reduce sampling bias that could occur with the bounds-based uniform sampling available in previous ParaView versions. The first new mode, “Uniform Spatial Distribution (Surface Sampling)”, performs uniform sampling based on surface area. In this mode, the surface is extracted first if required, so the glyphs will be located on the surface mesh only. The other new mode, “Uniform Spatial Distribution (Volume Sampling)”, uses cell volume (non-3D cells are ignored) when performing the sampling.
Both modes support multiblocks and parallel meshes, as well as cell centers when using cell data.
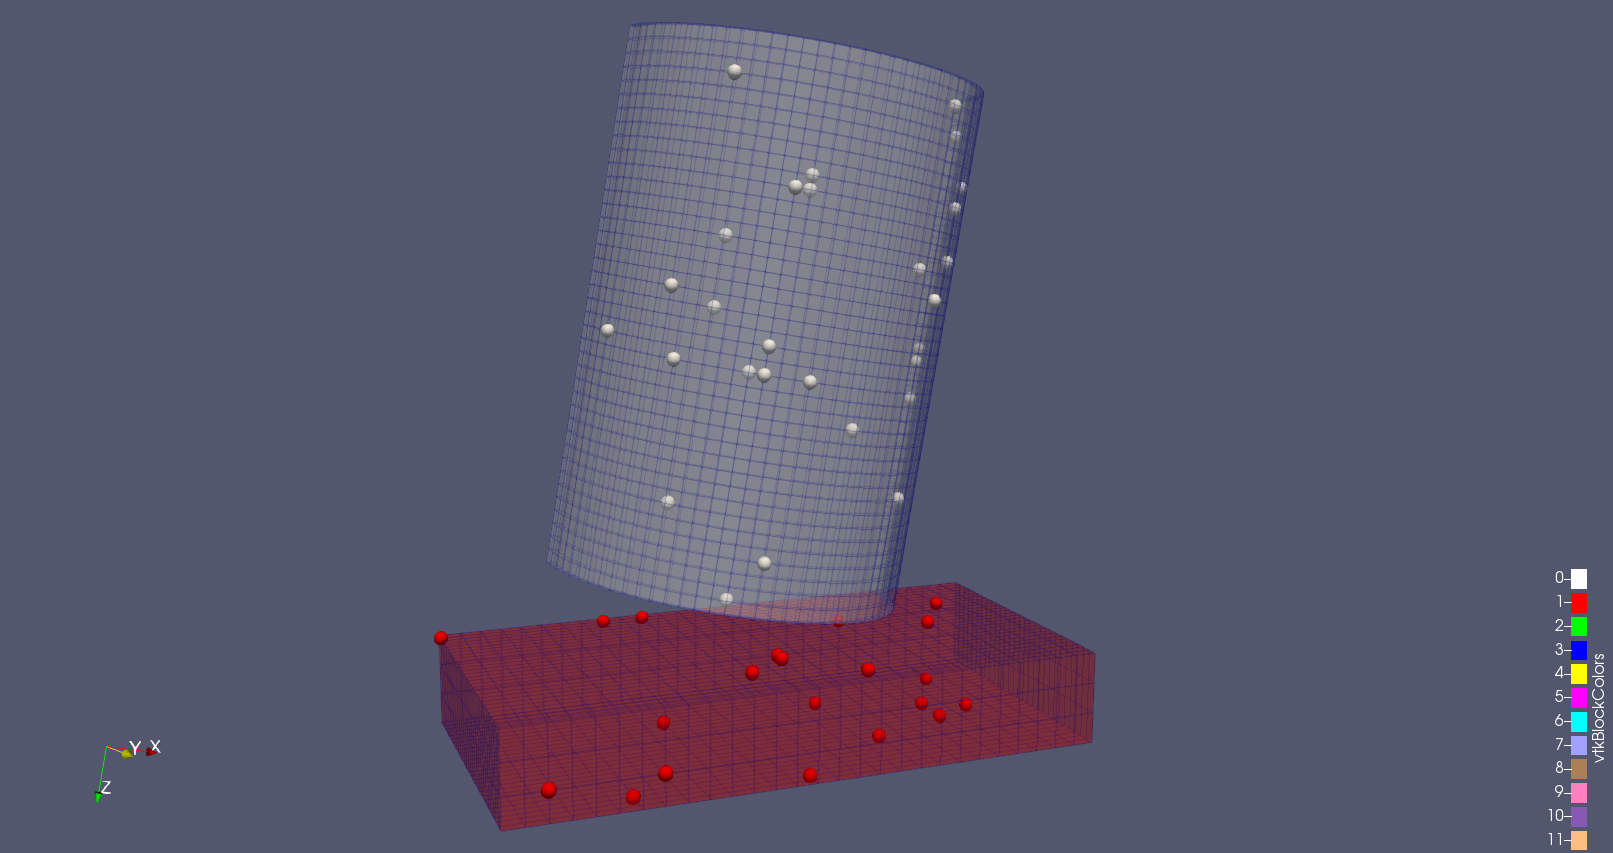

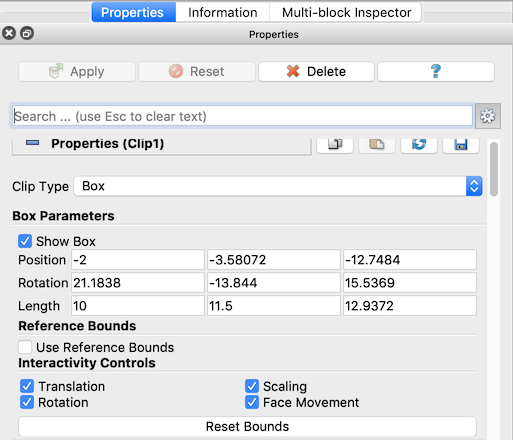
Improvements to “Box” implicit function specification
“Box” is one of the supported implicit functions for filters like Clip and Slice. The box is now specified using position, rotation, and scale parameters relative to the global coordinate space rather than the input dataset bounds. ParaView also supports specifying the box parameters relative to an arbitrary bounding box which can now be explicitly set in the UI.
Append Datasets and Merge Blocks allow selection of output type
The Append Datasets and Merge Blocks filters each have a new advanced property enabling the selection of the output type. If the output type is specified as a “Polygonal Mesh”, then only polygonal meshes from the inputs/input blocks are merged into an output of type Polygonal Mesh. If the output type is “Unstructured Grid”, then all inputs/blocks will be merged into an output of type Unstructured Grid.
Add Merge duplicated points option to Slice filter
By default, the Slice filter merges points in its output. The new option makes it possible to disable point merging.
Connectivity filter can sort region IDs by cell count
A new property Region Id Assignment Mode that can be used to order the region IDs assigned to cells and points. Supported modes are “Unspecified” where region IDs will be assigned in no particular order, “Cell Count Descending” assigns increasing region IDs to connected components with progressively smaller cell counts, and “Cell Count Ascending” assigns increasing region IDs to connected components with progressively larger cell counts. Region IDs continue to be stored in a “RegionId” array in the output of the filter.
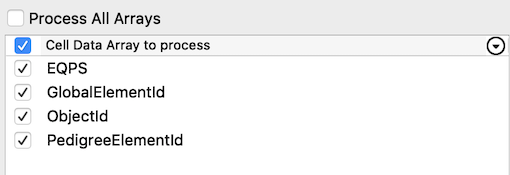
New point/cell data conversion options
The Point Data to Cell Data and Cell Data to Point Data filters now make it possible to select which arrays to convert. By default, all arrays will be converted, but if the Process All Arrays option is disabled, a table of arrays available for conversion will appear in the UI enabling selection of arrays to convert.
When the global Auto Convert Properties setting is enabled in ParaView, point and cell arrays are automatically converted when one type is required for a filter but only the other type is available. In previous versions of ParaView, all arrays were converted even though only one was needed. This was inefficient and a waste of memory. Now, only the requested arrays are converted automatically.
Renamed sources for Resample With Dataset
The source names have been clarified in the Resample With Dataset filter. Input has been renamed Source Data Arrays and Source has been renamed Destination Mesh.
Lagrangian Particle Tracker SMP implementation
The Lagragian Particle Tracker filter, provided in a plugin in ParaView, has been reimplemented with a multithreaded algorithm using the VTK SMP backend. These changes imply some changes on any previously developer user-developed Lagrangian Integration models as some method signatures have been modified. Please refer to the related discourse post for more information. For background on the Lagrangian Particle Tracker, please see this blog post.
Bag Plot Matrix View and MultiDimensional Bag Plot
A new property has been added to the Extract Bag Plot filter to allow the generation of multi-dimensional outputs. A Bag Plot Matrix view has been added specifically to visualize this data correctly in a Plot Matrix view.
Bag Plot features moved to plugin
All Bag Plot-related features of ParaView were moved into a specific plugin called BagPlotViewsAndFilters. This plugin is available to load in the Plugin Manager in ParaView.
NetCDF Time Annotation Filter Plugin
The new NetCDFTimeAnnotationPlugin exposes a filter called NetCDF Time Annotation Filter that can be used to easily display an annotation with the current NetCDF time of the data. This filter benefits from a new feature of the NetCDF reader that now creates field data arrays with the time units and calendar of the produced data. The filter is a compound filter that encapsulates a Programmable Filter and a Python Annotation filter.
Important note: This plugin requires the third-party netcdftime Python module, which is not included in the ParaView binaries available on www.paraview.org. It is required to have it installed in order to build and use this filter.
Readers, writers, and sources
glTF 2.0 Reader Plugin
The GLTFReader plugin adds functionality for opening glTF 2.0 files, which includes:
- Reading geometry
- Changing scenes
- Enabling, disabling and playing animations
- Animation sample rate adjustments
- Enabling or disabling deformations
The plugin does not yet support materials, textures or color information.
glTF exporter
ParaView can export scenes to the glTF 2.0 file format. It currently supports a limited subset of what ParaView can render, but polygonal meshes and optional vertex colors can be exported to glTF.
AMReX Grid Reader
ParaView now has a raw reader for directly reading AMReX plotfiles grid data without the third-party boxlib or AMReX libraries. The reader is based on the AMReX source code for writing and reading plotfiles AMReX code. This reader extends the work started for reading AMReX particle plotfiles. The reader extends the base vtkAMRBaseReader, which, in turn, extends vtkOverlappingAMRAlgorithm producing a vtkOverlappingAMR set of vtkUniformGrids. The reader allows for the processing of a time series of AMReX data sets. The selection of the visible AMR layers and fields is made available through the ParaView graphic user interface (GUI) similar to other readers that extend vtkAMRBaseReader.
GmshReader plugin
The XML interface file (.mshi) for the GmshReader plugin has been simplified and made more flexible. The documentation has been updated accordingly in Plugins/GmshReader/README.md in the ParaView source directory, along with the test data.
The Gmsh API has changed since Gmsh 4.1.0 so that another variant of the msh 2 format named “SeparateViews”, which is better suited for massively parallel simulations, can be handled by the plugin, along with the traditional “SingleFile” and “SeparateFiles” variants of the msh 2 format.
The minimum Gmsh version required by the plugin has been changed to 4.1.0.
ExodusII reader performance improvement
A bug that could dramatically slow reading of Exodus II file series in ParaView 5.6.0 was fixed.
SEP Reader
A reader for Stanford Exploration Project (SEP) files is now included in ParaView.
ParFlow reader
- ParaView can now read ParFlow’s simulation output (files named .pfb and .C.pfb).
- Preliminary support for reading multiple ParFlow files onto a single pair of meshes (surface and subsurface) is also provided; it expects JSON files with a .pfmetadata extension.
- Example Python filters are included to calculate:
- Total subsurface storage
- Water table depth at every surface point
- Total water balance (including subsurface storage, surface storage, and surface runoff).
CGNS reader changes
The CGNS reader has a new capability to store a mesh on user demand (Caching Mesh Points button) that allows faster loading of unsteady solutions when animating flows and makes it smoother to load/unload variables while doing interactive analysis.
In addition, a crash that occurred when CGNS files were reloaded has been fixed.
Upgrade of ICON/CDI netCDF reader
The CDI reader has been updated to read ICON netCDF files from users of the ICON model used in climate science.
Parallel EnSight Gold reader handles larger files
The Parallel EnSight Gold reader has been updated to support loading EnSight Gold files with up to the maximum number of points and cells supported by the file format.
Improve CSV, TSV and TXT output from parallel server runs
Improving the comma-separated value (.csv), tab-separated value (.tsv) and text (.txt) output to work better in parallel using a pass-the-baton parallel approach that has all processes take turns passing their data to process 0 for writing to disk. Additionally, composite datasets are now written out into a single file instead of a file per block.
Parallel XML writers are now available in serial
The parallel XML writers are now available for saving data in the GUI as well as via the Python SaveData() method when the server is run with a single process. This enables you to record Python traces in serial and then run the resulting Python script later on in parallel.
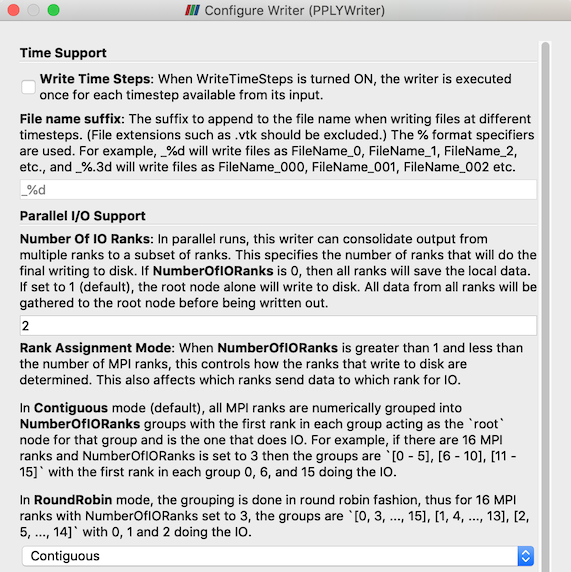
Improvements to several non-parallel writers (STL, PLY, VTK, and others)
Writers for file formats such as STL, PLY, legacy VTK, which do not support parallel writing, historically reduced all data to the root node when running in parallel, then wrote the data out on that node alone. To better support large data use-cases, you can now choose a subset of ranks to reduce the data to and write files from. Using contiguous or round-robin grouping on ranks, this mechanism enables use-cases where multiple MPI ranks are executing on the same node and you want to nominate one rank per node to do the IO.
Interface improvements
New button in view toolbar to save view content to clipboard or file.
A new Screenshot button is added to the right of the Undo/Redo buttons. It can also be accessed through the new Copy Screenshot to Clipboard item in the Edit menu.
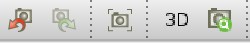
When clicked without pressing a keyboard modifier (Ctrl, Alt or Shift), the capture is performed to the clipboard. Otherwise, the button/menu acts as a shortcut to File > Save Screenshot (to a file). Note that this feature is available only for render and chart views.
New scalarbar auto-update option
Add an option to auto update the scalar bar range to be the same as the array range of the data when the Apply button is pressed. Previously existing options allowed the range to only grow when the Apply button was pressed.
Changes to zoom-to-box
Zoom-to-box now defaults to anchoring the corner points of the box at the point where the interaction starts. You can switch to centering the box at the interaction start point instead (the default in ParaView versions prior to 5.7) by using the Control or Shift keys.
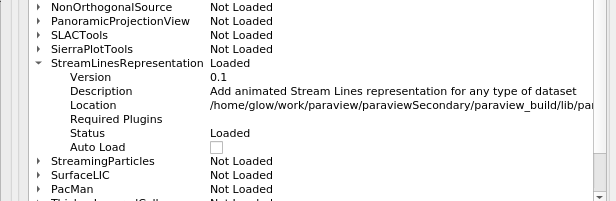
Plugin descriptions
The Plugin Manager dialog now shows plugin descriptions. The description for a plugin is shown only after a plugin is loaded.
New setting for default Render View interaction mode
A new ParaView setting has been added to render views for the 2D/3D interaction mode to use when loading a new dataset. The default behavior, called “Automatic”, works the same as in previous versions of ParaView, in which the interaction mode is set to 2D or 3D based on the geometric bounds of the dataset. New options are now available to override this, and alternatively specify “Always 2D” or “Always 3D”.
Simpler SSH configuration
Instead of relying on a complex .pvsc file, it is now possible to use the following XML elements to configure client/server connections through SSH:
- <SSHCommand exec=…> instead of <Command exec=…> so the command will be executed through SSH
- <SSHConfig user=”user”>, child of <SSHCommand> with an optional argument to set the SSH user
- <Terminal exec=/path/to/term/>, child of <SSHConfig> with an optional terminal executable argument. When this tag is set, the SSH command will be executed through on a new terminal
- <SSH exec=/path/to/ssh/>, child of <SSHConfig> with an ssh executable argument. When this tag is set and the executable is specified, a specific ssh executable will be used
- <Askpass/>, child of <SSHConfig>, so an askpass program is used. Make sure to set SSH_ASKPASS and DISPLAY before using this. Incompatible with <Terminal> tag, only available on Linux.
- <PortForwarding local=”port”>, child of <SSHConfig> with an optional local port argument, this is the biggest change. This allow to set up port forwarding through SSH tunneling. If no local port is defined, the server port will be used.
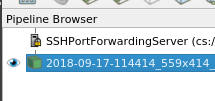
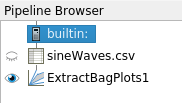
When PortForwarding is used, it is completely invisible to the user, the remote host and port are correct and not related to the SSH tunneling. In order to inform the user that the communication between client and server is secured, the server icon in the pipeline browser is augmented with a padlock.
Example of a simple configuration file:
Also, the new environment variable PV_SSH_PF_SERVER_PORT should be set when performing reverse connection with port forwarding.
In order to be able to use it you need:
- On Linux: any terminal emulator, ssh (default on most distributions) and ssh_askpass if needed
- On Windows: Preferably an installed Putty (plink), alternatively, Windows 10 spring update SSH client, and cmd.exe (default)
- On MacOS: Terminal.app and ssh (both default)
For more information on how to use this new configuration file schema, see this post on the ParaView Discourse forum.
Consistent time selection controls
The time selection controls are now consistent between the Current Time Controls toolbar and Animation View.
Python scripting improvements
Python Trace window scrolls to the bottom when tracing
When a Python Trace is active and the option to update the Show Incremental Trace option is enabled, the window showing the trace will scroll to the bottom as new trace code is added.
Layouts and Python support
Mutliple views and layouts are now better traced in Python. When the generated trace is played back in the GUI, the views are laid out as expected. Also, Python state can now capture the view layout state faithfully.
Developers and Python users must note that view creation APIs no longer automatically assign views to a layout. One must use explicit function calls to assign a view to a layout after creation.
OpenGL information retrieval in paraview.simple module
A new function, GetOpenGLInformation(), has been added to the paraview.simple module. It enables recovery of OpenGL related information, like GPU vendor, OpenGL version, and capabilities.
It can be used as follows
openGLInfo = GetOpenGLInformation()
openGLInfo.GetVendor()
openGLInfo.GetVersion()
openGLInfo.GetRenderer()
openGLInfo.GetCapabilities()

openGLInfo = GetOpenGLInformation(servermanager.vtkSMSession.RENDER_SERVER)
openGLInfo.GetVendor()
openGLInfo.GetVersion()
openGLInfo.GetRenderer()
openGLInfo.GetCapabilities()
Tracing of animation controls and camera links
Changes to time and animation controls are now recorded in Python traces. Additionally, the setup of camera links is recorded.
Molecular data enhancements
Improvements to Graph and Molecules support
ParaView provides the following features that augment Graph and Molecule data support:
- Panel information shows values for graphs and molecules
- The Calculator filter supports graphs and molecules as input
- The Molecule representation now supports the Map Scalars display property. As is the case with other datasets, this property disables color mapping when on and uses direct RGB values from a the color array as long as it contains 3-components.
Molecule representation updates
Additional molecule mapper properties, such as atom/bond size and color, are now available in the molecule representation.
Presets that control the new molecule mapper properties have been added, and are available from the GUI and from Python.
Miscellaneous bug fixes
Opacity function editor
A bug in the opacity function editor widget that occurred when the range was changing from a high minimum to a low maximum value resulting in the opacity editor becoming white has been fixed.
Color transfer function editor bug when log scaling is on
The color transfer function editor widget could get in a bad state when log scaling was enabled. This bug has been fixed.
Slice view interactive point selection and hover over points fixed
In the Slice view, interactive point selection and hover over points features were buggy. That problem has been solved in this release.
Freeze selection fix
A bug that occurred when freezing selections on composite datasets has been fixed.
Context menu on HiDPI displays
When right-clicking on render views, the incorrect data object could be selected on HiDPI displays. This issue has been fixed.
Cell Centers bug with vtkEmptyCells fixed
The Cell Centers filter had incorrect behavior with vtkEmptyCells. The filter used to replace empty cells by uninitialized points and did not copy cell data to point data for such cases. Now, ParaView makes sure that th Cell Centers filter does not create points; for empty cells and ensure that point data are correctly mapped to input cell data.
Random Attributes filter produces additional array type
Random Attributes can now generate attributes of type vtkIdType.
Developer notes
pvconfig-cleanup
- The vtkPVConfig.h header no longer provides feature details like whether MPI, Python, or various VisIt readers are enabled. Instead, CMake logic should be used to detect whether the metafeatures are enabled (VisIt readers are not exposed currently).
Quad-buffer stereo (Crystal Eyes active shutter glasses) on Linux and Windows
ParaView once again supports quad-buffer stereo for Linux and Windows. This functionality was lost during migration to Qt 5. With this release, ParaView uses a QOpenGLWindow-based rendering widget to support quad buffer stereo on Linux and Windows provided it is supported by your graphics card, drivers and window-manager. Quad buffer stereo is not supported on macOS.
Improvements to parallel rendering support
This release includes changes to the parallel rendering code to simplify the logic for developers and maintainers along with addressing some long standing issues with tile displays and CAVE rendering, especially when dealing with split views.
Developers developing new view types should note that the view API has been simplified considerably. Earlier views needed to handle the case where all views could be sharing the same render window on server processes. That is no longer the case. Each view now gets a complete render window and has control over the renderers added to that window. Server processes still have a share rendering window which is used to display the combined results from multiple views to the user via vtkPVProcessWindow, but vtkPVView subclasses don’t have to handle it. vtkViewLayout manages all the collecting of rendering results from each view and posting them to a user viewable window, if and when needed.
In CAVE mode, we now handle split views more consistently by ensuring only one of the views is presented in the CAVE. Currently, it’s the most recently rendered view.
Additionally, more logging entries were added that are logged under the PARAVIEW_LOG_RENDERING_VERBOSITY category that should diagnose parallel rendering issues.
Main window event handling has moved to behavior classes
ParaView and ParaView-derived applications have their own main window class that inherits from QMainWindow. The standard Qt approach to intercepting signals from the main window (e.g. “close application”) is to reimplement QMainWindow‘s event methods (e.g. closeEvent(QCloseEvent*)). This polymorphic solution is not available to ParaView-derived applications comprised of plugins, however. To facilitate a plugin’s ability to influence the behavior of ParaView’s main window, ParaView now has pqMainWindowEventManager, a manager that emits signals when the main window receives events. These signals are connected to pqMainWindowEventBehavior, a behavior class for performing tasks originally executed in ParaViewMainWindow (with the exception of the splash screen).
Showing information_only properties in the Properties Panel
Previously, it was not possible to show a widget for an information_only property. It is now possible by declaring the panel_visibility attribute in the declaration of the property. By default, and contrary to non-information-only properties, the default value (when not specified) is never (instead of default for standard properties). Note that when the widget is shown, it will always be disabled (i.e., not editable) because it is read-only.
Here is a simple example showing how to expose an information_onlyproperty in the GUI:
PipelineIcon filter hint in server manager XML
XML filter definitions can now specify the pipeline icon to use for a specific filter or output port. The icon can be either a view type name or an existing icon resource.
Moving away from named domains
The name of domains in XML properties used to have an impact on how this property will be shown in the UI. This was quite error prone. We have now completely moved away from named domains. The name of the domain in the XML property does not matter, with the notable exeception of:
- InputArrayDomain name still matters as it can then be used in an ArrayListDomain.
- glyph_scale_factor panel widget still requires the usage of two domains named scalar_range and vector_range. This is error prone and will be corrected in the future with a domain dedicated to it.
XML properties inherited from base proxy can be overridden
override is a keyword that previously allowed replacement of properties from a base proxy in an inherited proxy. Improvement to this mechanism comes in two forms:
- It supports any type of property
- The base proxy property is actually replaced instead of removing/adding it, hence it appears at the same location in the UI.
SpreadSheet view
The ability to subclass of the SpreadSheet view in ParaView-based applications has been improved.
Catalyst
Spatio-temporal batch parallel capability promoted
ParaView’s spatio-temporal batch parallel capability has been promoted from a non-default plugin to a core feature that comes with every Python-enabled ParaView build. Read more…
Congratulations to all, what a massive upgrade! I really appreciate all the work that you all have done.
On behalf of the 51 people who contributed features and bug fixes to this release over the last 11 months, thank you.