
ParaView Catalyst: Enabling In Situ Analysis and Visualization

It is becoming increasingly difficult to efficiently leverage supercomputers for computational research. There are a variety of factors contributing to this: more concurrency, heterogeneous processing units, relative slow-down of memory bandwidth, and file IO to processing power, etc. This corresponds to a large increase in our ability to crunch numbers with a small increase in the ability to gain insight into these numbers. In the simulation world, the classical workflow involves creating a simulation input, computing results, and post-processing those results. This is shown in Figure 1.
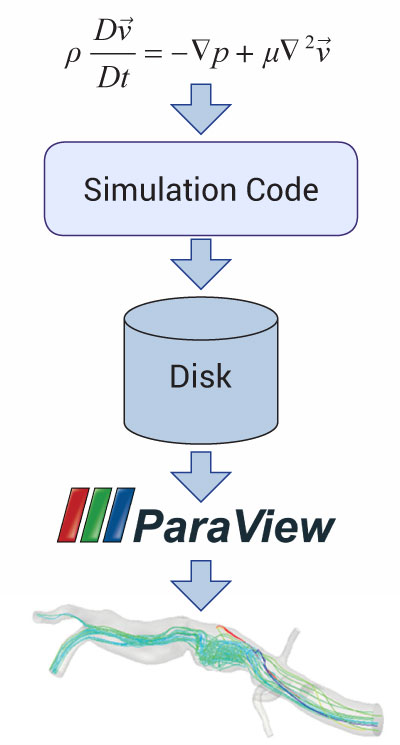
Figure 1: Traditional workflow.
With the trends of supercomputing, this workflow will not fully realize the goal of quick turnaround for gaining valuable insights from numerical experiments. The numerical experiments will run quicker due to the increase in computing power. However, the bottleneck is moving from running the actual simulation to post-processing the results to gain insight into the problem at hand. The main issue is dealing with the data efficiently. This classical workflow involves writing a large amount of the simulation data to disk just to read it back in again to do post-processing. For the situation where the post-processing is done on a separate machine, at best it has only one magnitude less computing power than the supercomputer the data was computed on exacerbating the issue. If this separate machine doesn’t share a disk with the supercomputer then this involves another file transfer which again slows down the workflow.
Enabling In Situ Analysis and Visualization
Our solution to this problem is to perform visualization and analysis on the supercomputer as the simulation is running. This has a variety of names including in situ, co-processing and co-visualization. There are many advantages to this. The first is that we can begin the analysis and visualization process without having to do any file IO for the simulation results. The second is that we have the full compute power of the supercomputer available to do this processing. Additionally we expect that writing the results from the analysis and visualization will be much smaller than the original full simulation data. Generally, the desired results can be saved in a much more compact form than the original data such as streamlines, lift on a wing, maximum stress, etc. This leads to dealing with simulation-generated data that is in a much more compact form, and also has the benefit of not requiring significant extra post-processing in order to gain insight into the problem at hand.
ParaView Catalyst for In Situ computing
While there has been significant work on performing in situ analysis and visualization, our goal was to create a general library that could easily be used to analyze and visualize data in a variety of ways. If the user can do their post-processing with ParaView they can use Catalyst for co-processing. ParaView and VTK have already been demonstrated to be successful tools for post-processing analysis and visualization for a wide variety of simulations. Catalyst has been a relatively new addition to ParaView to enable the same analysis and visualization tools that are already available for post-processing to be provided for in situ processing. Additionally, one of the design goals of ParaView Catalyst was to make it very simple for simulation users to create customized outputs in a workflow that they are already familiar with. This is done through ParaView’s CoProcessing plugin. In this new workflow, instead of dealing with the large data sets output from a simulation code the user specifies their desired output during the pre-processing stage by using this plugin. They essentially create the pipelines to process the results in their desired manner. At the end of the co-processing pipelines, instead of writing out data extracts (e.g. contours, streamlines, etc.) and/or screenshots, the user specifies individual frequencies for outputting these data extracts and/or screenshots. All of this information is saved in a Python script.
When the simulation is run with Catalyst, these pipelines will be executed at the requested time steps. Note that each sink in the pipeline can have an independent output frequency. For the adventurous, these Python scripts can be edited to contain more sophisticated logic to better extract desired data. information. This new workflow is shown in the image below.
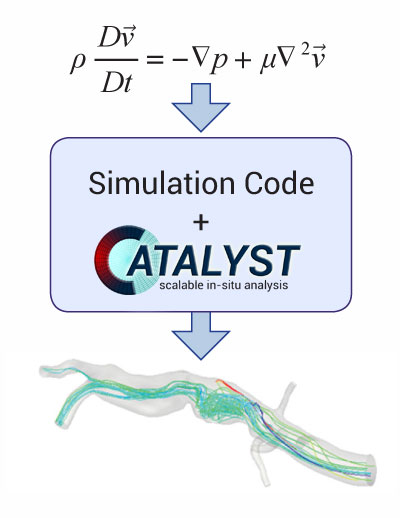
Figure 2: ParaView Catalyst enabled workflow.
ParaView Catalyst Details
The easiest way to get access to ParaView Catalyst is through a regular ParaView build. By default, the CMake option to enable the API to Catalyst is turned on (the option is PARAVIEW_ENABLE_CATALYST). Typically, Catalyst is also built with MPI and Python enabled, although neither are required to use the Catalyst libraries. Additionally, with the next release of ParaView (version 4.1) we will also be releasing “editions” of Catalyst. The purpose of these editions is to reduce the overhead of linking to Catalyst. While ParaView and VTK contain a wide variety of analysis and visualization tools, a Catalyst-enabled simulation run will typically use a very small subset of those tools. The rest of the tools can result in a fairly large overhead in libraries that a simulation code needs to link to. For example, if no screenshots are desired from Catalyst then it doesn’t make sense to include all of the rendering and compositing parts of ParaView and VTK plus their dependencies (e.g. an OpenGL implementation). Our experience to date has shown that we can reduce the library size by over 100 MBs by using specific Catalyst editions for simulation runs. While this may not seem like a large amount by itself, considering the fact that multiple copies of the libraries will need to be loaded for a large simulation run, the numbers can add up quickly. For static executables, each MPI process will store a full copy of the executable. For executables that use dynamic libraries, only a single copy of a shared library per node is needed but each shared library needs to be loaded into memory which can severely burden the IO system. For a supercomputer like Hopper at NERSC with 6,384 compute nodes and 24 cores per node, this would correspond to over 600 GBs of extra storage for executables with shared libraries or 15 TBs of extra storage for static executables when running at full scale.
Interfacing a Simulation Code to ParaView Catalyst
In order for a simulation code to use Catalyst for co-processing, it must store the simulation data in a format that ParaView understands. Essentially, this means that the simulation data must be stored using VTK’s data model. This information is beyond the scope of this article but is covered thoroughly in the ParaView Catalyst User’s Guide (http://paraview.org/Wiki/images/4/48/CatalystUsersGuide.pdf). The design that was used for ParaView Catalyst leverages an adaptor that bridges the information in the simulation code’s data structures and VTK’s data structures. This is shown in the figure below.
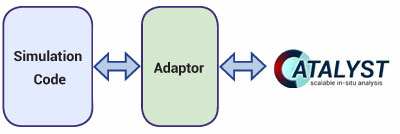
Figure 3: Design to bridge between the solver and Catalyst.
This design isolates the simulation code’s dependency on Catalyst such that it doesn’t need to include any VTK or ParaView classes in that code base. Additionally, Catalyst doesn’t need to be modified to gain access to the simulation code’s data structures. The adaptor is responsible for passing in situ details to Catalyst (e.g. the Python scripts, simulation time step, etc.) and translating the simulation code’s data structures to VTK data structures. The interface between the simulation code and the adaptor is normally done through function calls. Typically there are only a handful of calls to pass the proper information to the adaptor. These are:
- Initialization call: This call initializes both the adaptor and Catalyst. This is where the co-processing pipelines are set up in Catalyst.
- Processing call: This call checks to see if any co-processing needs to be performed. If a pipeline needs to execute, the adaptor is responsible for creating/updating the VTK data structures from the current simulation code state so that the pipelines can execute with that data.
- Finalization call: This call cleans up any state in the adaptor and/or Catalyst.
As can be seen with this design, the functional interface allows a minimal code footprint inside of the simulation code codebase.
For more information on ParaView Catalyst, visit the web-site at http://catalyst.paraview.org/.
Acknowledgements
Initial funding for ParaView Catalyst development was through Army SBIR contract W91126-08-C-0062. ParaView Catalyst was developed collaboratively between Sandia National Laboratories, Los Alamos Laboratory, the Army’s Aeroflightdynamics Directorate, and Kitware. Sandia National Laboratories is a multi-program laboratory managed and operated by Sandia Corporation, a wholly owned subsidiary of Lockheed Martin Corporation, for the U.S. Department of Energy’s National Nuclear Security Administration under contract DE-AC04-94AL85000.

Andrew Bauer is an R&D Engineer in the scientific computing team at Kitware. He primarily works on enabling tools and technologies for HPC simulations.