
ParaView Query Selection Framework

With ParaView version 3.14 (released February 19th) comes a revamped data selection framework. The most prominent user-facing feature is the redesigned query dialog, which is available from the “Find Data” tool in ParaView’s Edit menu.
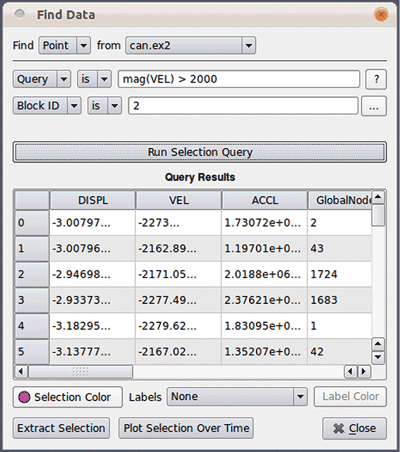
Figure 1: Selecting each point in block 2 for which the magnitude of the velocity exceeds 2000.
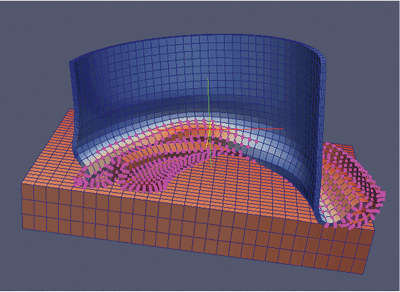
Figure 2: Highlighted data from the selection made in Figure 1.
ParaView previously contained only a handful of predefined selection types (e.g. ID’s, Threshold, Frustum). The former selection framework, while powerful, was inflexible. The new query selection framework allows users to specify arbitrarily complex queries using the Python language with the powerful NumPy module. NumPy is a widely used Python extension that allows for efficient numerical computing tasks to be performed via the high-level Python language.
Data queries are entered by the user as Python expressions, which then act on the data and yield a selected subset of that data. The selected data can then be extracted and manipulated further by use of the Extract Selection filter just as before.
Selection for composite (e.g. multi-block) datasets is also supported by specifying which blocks or levels are to be examined. The query expression is then tested against each piece of the composite dataset to determine the selected points or cells. An example of selecting a single block in a multi-block dataset is shown in Figure 2.
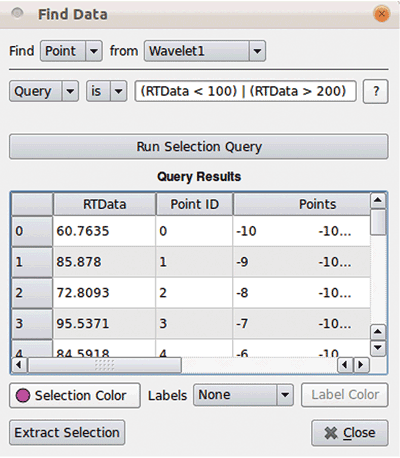 Figure 3: Performing a threshold selection on a wavelet data source.
The example in Figure 3 shows how to perform a threshold selection using the new query selection framework. Multiple queries can be joined together with boolean logic operators (e.g. and, or, not) allowing for specification of arbitrarily complex selections.
The new selection framework in ParaView 3.14 allows for data to be queried and examined in much more detail than in previous versions. Future developments will aim to support selection expressions for individual blocks of composite datasets.
 Kyle Lutz joined Kitware in June 2011 as a member of the Scientific Visualization team. He holds a bachelor’s degree in Biological Sciences from the University of California at Santa Barbara. While in college he developed the chemkit library, an open-source software library for chemistry.