
Sketchalyze: Structural Analysis Goes Mobile

For engineers and architects, it is essential to understand and communicate how the structure (cantilever, truss girder, frame, etc.) they are designing behaves under loading. The Sketcha-lyze app, built on top of VTK[1] / VES[2] and available in the App Store for free, aims to support professionals and students in this process by letting them sketch structural systems quickly and by providing deformations and internal forces of structural members immediately. The direct and intuitive way users can interact with the structural system on a tablet device makes it easy to try new ideas and encourages exploration of structural behavior by experimenting with geometry, loading, and dimensions.
The Sketchalyze app (Figure 1) provides tools to sketch a structural system in a way that is familiar to people who have used a drawing program before. A finite element computational core computes deformations and section forces on the device and common techniques such as vector warp, mapped colors, and line plots are applied for visualization. Whenever the system is modified, analysis results are recomputed, and the visualization is updated accordingly. The finite element analysis for small to medium sized structures is fast enough to provide a realtime feedback when a user manipulates the system.
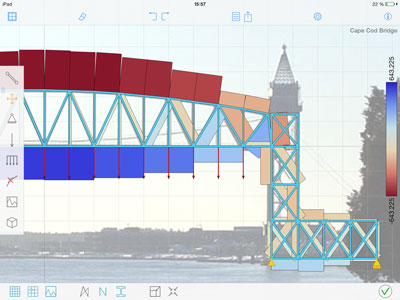
Figure 1: Sketchalyze (version 1.1 on iOS 7) showing axial forces of a bridge. The structural model was sketched using a photograph of the original bridge imported to the app
From the beginning of the project, it was clear that structures should be rendered in a full 3D volumetric representation and a choice regarding the related technology had to be made. The release of VES just before the Sketchalyze project got underway made for an easy decision, as VES leverages the visualization power of VTK.
Background
VES (VTK for Embedded Systems) is an open-source frame-work for accelerating mobile visualization on current generation mobile hardware. VES consists of two core libraries: VES and Kiwi. The VES library provides rendering capabilities and infrastructure for scene management by utilizing OpenGL ES 2.0 [3]. The Kiwi library is an application framework built on top of VES and VTK. Figure 2 shows the technology stack of VES based application to depict the relationship between different components.
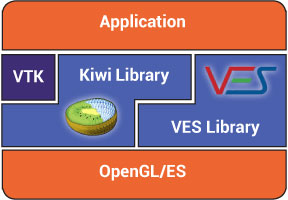
Figure 2: Stack diagram for VES based applications. Kiwi provides a GLUE layer between the VES core and VTK. VES supports OpenGL and OpenGL ES 2.0.
In the next section, we have described the implementation of Sketchalyze, which leveraged and extended VES for its own requirements. We are hoping that some of these new functionalities will be released in the next version of VES.
Implementation
The finite element core of Sketchalyze has been designed by the authors for the requirements of a highly interactive application. The interface between the finite element subsystem and the visualization subsystems is mostly based on function objects and local coordinate systems. Function objects encapsulate the mathematical functions which represent geometry (deformed and undeformed) as well as the computed member forces (normal force, shear force, bending moment). Most of the time, these functions are polynomials or piecewise polynomial. In the mechanical model of a structure, each member has an attached local coordinate system. The mechanical theory of one-dimensional continua like trusses or beams is based on a local coordinate system attached to the reference line of the member. For visualization purposes, this coordinate system can be conveniently used to transform point coordinates between local and global reference frames; our corresponding class provides the respective methods.
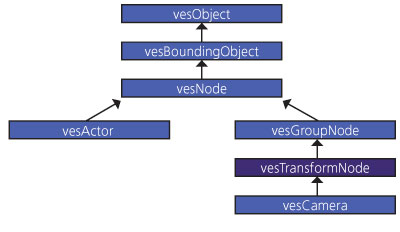
Several subclasses of vtkAlgorithm have been implemented in order to translate our domain-specific information into vtk-PolyData objects to be processed in the various pipelines for the individual model aspects.
Sources and Filters
Most fundamental is the ElementSource class which provides the vtkPolyData for the detailed representation of structural members. It uses the local element coordinate system (either in undeformed or deformed configurations) and transforms the vertices of the section to global coordinates (see Figure 3 top). In order to select a visually appealing representation at structural joints, all members connected to one node are investigated, and simple heuristic rules determine the choice between different drawing options (cut off, draw with capping, extend, draw rounded).
In structural analysis, it is common to draw the distribution of section forces as plot along the element length (see Figure 3 bottom). The corresponding vtkPolyData object is provided by the LinePlotSource class which also makes extensive use of the element’s local coordinate system.
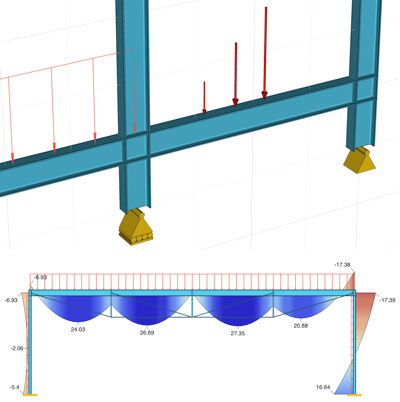
Figure 3: Sketchalyze structural models: Detail of a beam structure and distribution of bending moments in a suspended frame under line loads.
Structural supports are visualized by symbols reminiscent of historical bridge bearings. Figure 3 (top) shows two constraint symbols which allow for a rotation about exactly one axis, the left one can move horizontally, the other one does not allow translations. Generally, in three dimensions, there are 26 = 64 (3 translations, 3 rotations) types of supports. The visual representation is generated by a vtkGlyph3D in conjunction with our generic ConstraintSymbolSource algorithm class which has 64 output ports, one for each support type. The input for the glyph is generated by a ConstraintSource class specific to our finite element model which tries to orient symbols such that they don’t overlap with elements.
Further developments include classes for generating visual representations of line loads and forces. Note the non-uniform scaling of force symbols in Figure 3 (top).
Hybrid actors
Textual annotations on top of the 3D representation are crucial, e.g. in order to include numerical values in a concise fashion. While VTK provides a wide range of 2D actors, this feature is not yet present in VES. However, it was surprisingly simple to include hybrid 2D drawing for iOS. We introduced a vesActor2D class which draws on a glass pane on top of the GLKView. The view class maintains a list of its 2D actors and lets them draw when necessary. The following snippet of Objective-C++ code shows the stripped down drawing (some coordinate handling is omitted) method of a vesActor2D subclass which displays labels for scalar point data.
(void)drawRect:(CGRect)rect inView:(vesView *)view

 {
double p[3], pD[3];
vtkPolyData *pd = ...; // get input polydata
vtkPoints *points = pd->GetPoints();
   vtkDataArray *data = pd->

   GetPointData()->GetScalars();
for (int i = 0; i < points->
GetNumberOfPoints(); i++) {
NSString *s =
      [NSString stringWithFormat:@"%f", data->

     GetTuple1(i)];
points->GetPoint(i, p);
worldToDisplay(view, p, pD);
     [s drawAtPoint:CGPointMake(pD[0], pD[1])

       withAttributes:nil];
}
}
User Interactions
There exist various alternatives to implementing user interactions in a 3D software system. For instance, the vesKiwiWidgetRepresentation lets subclasses handle gestures. Simplicity is one of the main advantages of this approach. On the other hand, it may lead to difficulty in maintaining code in complex software projects since it becomes very easy to mix application logic into view objects. For this reason, we decided to handle interactions at the UIView level. Gestures are recognized and forwarded to the active tool object which interprets the raw input and translates it into modifications of the finite element model.
Different tools let users create elements; move nodes or elements; and add and manipulate forces or loads etc. The most important class in this context is the WorkingPlane. It converts the coordinates of a point from view to world coordinates, handles snap-to-grid, and is able to locate model objects. This picking capability is currently implemented by a linear search in the model, and for the model size targeted by the Sketchalyze app.
Performance Considerations
Performance is crucial for an app like Sketchalyze. Only if models can be created and manipulated fluently, is a good user experience guaranteed. Currently, for a mid sized structure with about 50 members, the app operates at a rate of around 5 frames per seconds (depending on the type of section etc.) on an iPad 3 including the finite element analysis and the generation of approx. 10000 polygons of polydata. Although we still have continued development to do, we have tackled several iterations in analyzing and improving performance bottlenecks to produce Sketchalyze 1.0.
Other than initially expected, it turned out that the finite element analysis is not critical for the overall performance (as long as a linear analysis is performed). The amount of time needed for the analysis of a small structure with 50 members is around 0.04 seconds on an iPad 3.
Most relevant for performance is the element source which generates several thousands of polygons and points. By default, normals and triangles are generated by VTK filters and then the data is handed over to VES. Therefore, the first step in improving the performance was to include the normals generation into our ElementSource class. It now generates triangle strips and normals, thus improving the overall performance.
Another crucial piece of code is the conversion of coordinates from the element frame to the global system. After experimenting with functions from Apple’s Accelerate framework (which contains a BLAS implementation), it turned out that it is most efficient to unroll the loops and type things out. Further performance improvements might be achieved using SIMD instructions on NE-ON.
Acknowledgements
The Sketchalyze app started as Master’s thesis of Duy Thanh Tru o ng and has been supported by the Vietnamese-German University, the University of Bochum and the University of Kassel.
References
- Kitware, Inc. The VTK User's Guide. Ed. William J Schroed-er. Kitware, Inc., 2010., http://vtk.org
- VES, http://www.ves.vtk.org
- OpenGL ES, http://www.khronos.org/opengles

Matthias Baitsch is interim professor for structural analysis at the University of Kassel, Germany. He has a background in civil engineering with a focus on design optimization and numerical methods.

Duy Thanh Truong studied Computational Engineering at the Vietnamese-German University (Ho Chi Minh City, Vietnam) and received his M.Sc. from Ruhr-University Bochum (Bochum, Germany). He is the main developer of Sketchalyze and currently working as research assistant at the University of Kassel (Germany).

Aashish Chaudhary is an R&D Engineer on the Scientific Computing team at Kitware. Prior to joining Kitware, he developed a graphics engine and open-source tools for information and geo-visualization. Some of his interests are software engineering, rendering, and visualization
Did you know that Using VES and Kiwi, you can build your own Android or iOS apps?
For Android devices, developers can use CMake and the Android Native Development Kit (NDK) to cross-compile VTK and the VES/Kiwi libraries for Android. Developers can further enhance their apps by designing Java Native Interface (JNI) libraries. Similarly, on iOS, they can use CMake and the iOS SDK to cross-compile the libraries. With the KiwiViewer Android or iOS app, developers can then package assets, load data, and render geometry.
To learn more about VES and Kiwi for building Android apps, visit the Kitware webinar page to view the recorded Android tutorial webinar.
For help designing a custom visualization app tailored to your needs, please contact us at kitware@kitware.com.