
Updates and a new Addition to the ParaViewWeb Family

As noted previously on our blog, several updates have landed in ParaView and the Visualization Toolkit (VTK) that affect web-based projects, such as ParaViewWeb. ParaViewWeb enables visualization and data processing to occur interactively online. Multiple applications of ParaViewWeb improved with the updates. Here, we highlight Visualizer and ArcticViewer. We also formally introduce a new application, Divvy.
Visualizer
Visualizer is the ParaView client for the web. It leverages the same user interface for source and filter properties as the Qt client of ParaView. We recently improved the property panel of the interface to properly handle and represent groups. Thanks to those changes, it is much easier to find and understand source and filter properties in Visualizer.
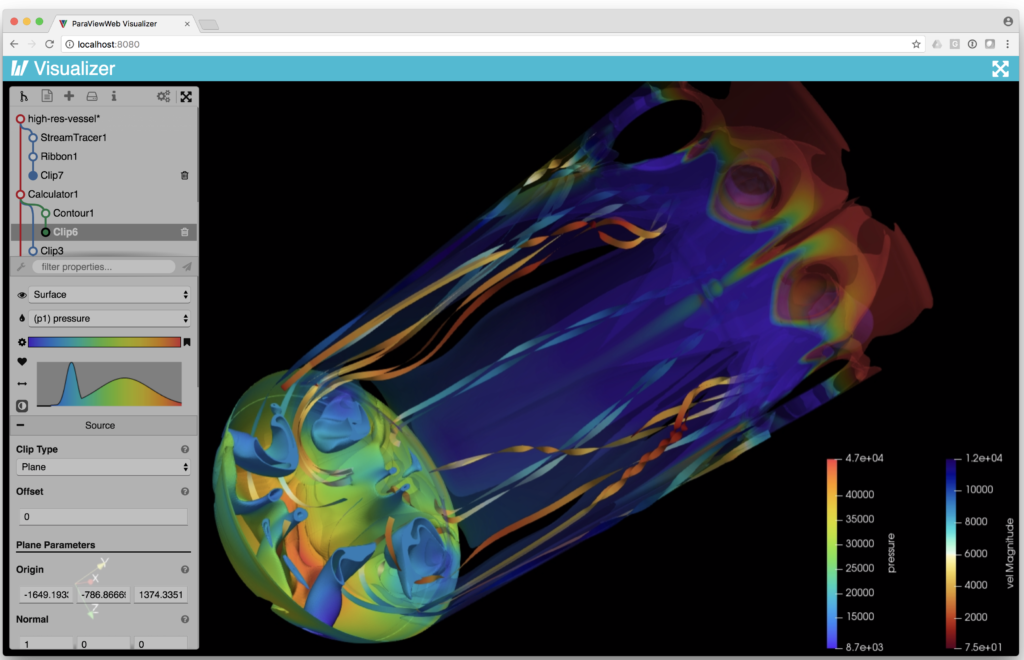
We also updated the piecewise function editor in Visualizer to leverage the one that is available in the Visualization Toolkit for JavaScript (vtk.js). Last week, we announced version 5.3.5 of the vtk.js system, which enables VTK data structures to be rendered on the web.
ArcticViewer
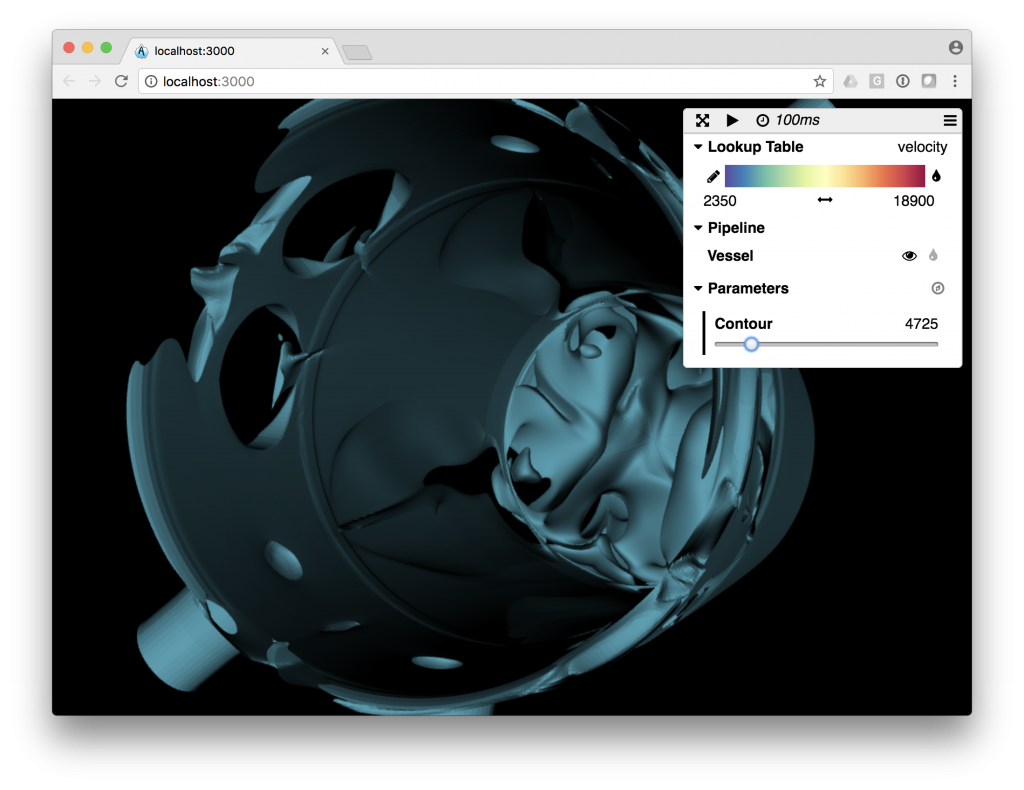
ArcticViewer can quickly render pre-computed assets. With the integration of ParaViewWeb and vtk.js, we extended ArcticViewer to load and play geometric and volumetric data in an interactive manner. As a result, ArcticViewer can now visualize three-dimensional (3D) meshes and volumes across time or other parameters.
Divvy
Divvy is the new kid in the ParaViewWeb family. Divvy uses ParaView as its data processing and visualization backend to provide an analytical view of data. In particular, Divvy makes use of readers and rendering capabilities in ParaView to create a 3D scatterplot or to visualize a mesh rendering along with selected points.
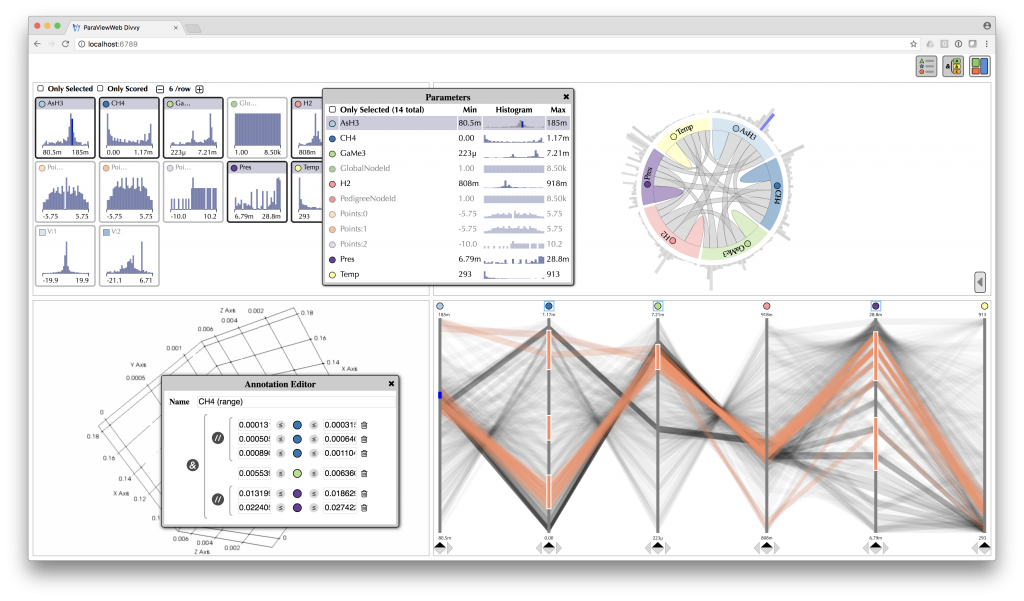
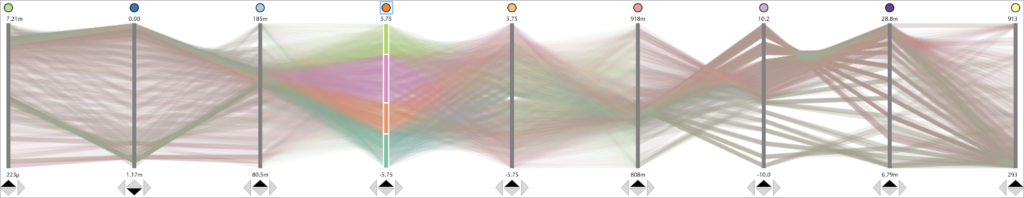
Divvy also makes extensive use of InfoViz components in ParaViewWeb, including ParallelCoordinates, MutualInformationDiagram and HistogramSelector. With HistogramSelector, you can look at individual data distributions in histograms to identify interesting data fields. With MutualInformationDiagram, you can explore shared information between data fields, and with ParallelCoordinates, you can make selections to label and divide your data into different groups of interest. These selections can help you analyze the relationships between data fields.
Visualizer, ArticViewer and Divvy are merely three of several ParaViewWeb applications. All are available as open source software, so you can try them for yourself today.