
Using the Color Map Editor in ParaView – The Annotations

In my previous blog post, we talked about using the Color Map Editor panel to set up the color and opacity transfer functions for scalar coloring. In this post, we take a look at color legend in 3D views and controlling the labels shown on the legend using annotations.
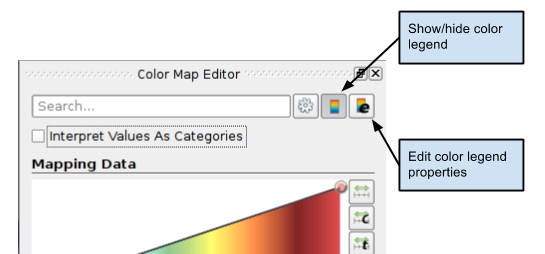
Figure 1: Color Map Editor panel showing buttons that affect the color legend
The Color Legend
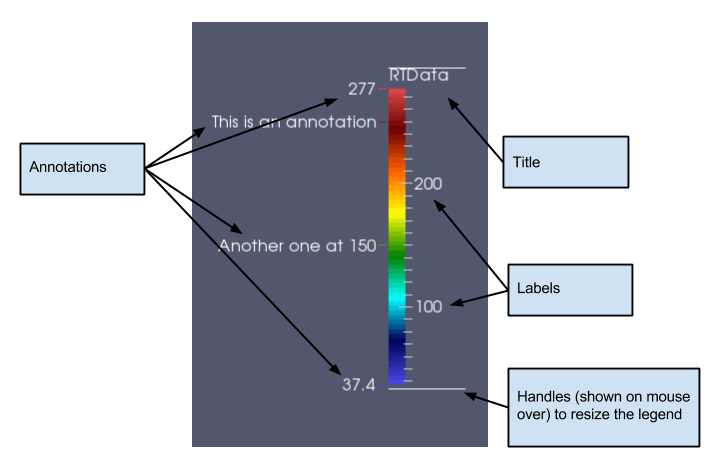
Figure 2: Color Legend
Figure 2 shows the various components of the color legend. By default, the title is typically the name of the array (and component number or magnitude for non-scalar data arrays) being mapped. On one side are the automatically generated labels, while on the other side are the annotations, including the start and end annotation which corresponding to the data range being mapped.
One can control the characteristics of the color legend using the Edit color legend properties button. The color legend in interactive. One can click and drag the legend to place it interactively at any position in the view. Additionally one can change the length of the legend by dragging the end-markers shown when one hovers the mouse pointer over the legend.
The Color Legend Parameters
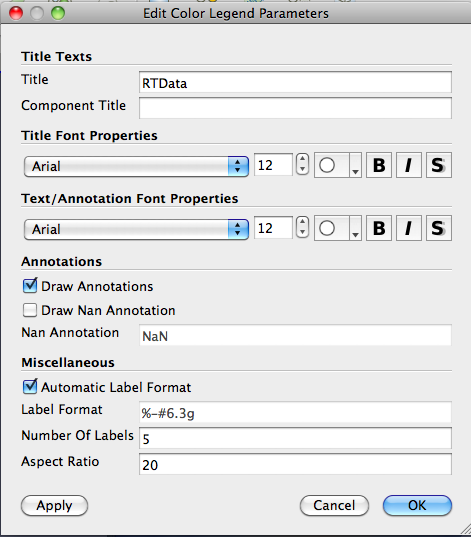
Figure 3: Edit color legend parameters dialog
Besides the obvious changing of title text and font properties for the title and labels and annotations, some of the other parameters that the user can change are as follows: Draw Annotations controls whether the annotations (including the start and end annotations) are to be drawn at all.
When checked, Draw NaN Annotations results in the color legend showing the NaN color setup in the Color Map Editor panel in a separate box right beside the color legend. The annotation text shown for that box can be changed by changing the NaN Annotation text.
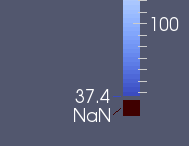
Figure 4: Color legend showing NaN annotation
The Annotations
Simply put, annotations allow users to put custom text at particular data values in the color legend. The min and max data mapped value annotations are automatically added, to add any other custom annotations, one can use the Color Map Editor.
Since annotations is an advanced parameter, one has to either toggle the visibility of advanced properties using the gear icon near the top of the panel, or simply search for Annotations in the search box. That will show the Annotations widget, which is basically a list widget where users can enter key-value pairs, rather value-annotation pairs, as shown in Figure 5.
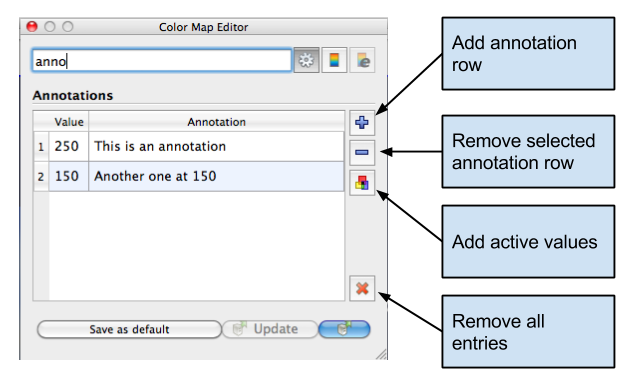
Figure 5: Widget to add/edit annotations on the Color Map Editor panel
One can use the Tab key to edit the next entry. Hitting Tab after editing the last entry in the table will automatically result in adding a new row, thus making it easier to add bunch of annotations without having to click any buttons.
There are two reasons under which annotation texts may not show up on the legend: first, the value added is outside the mapped range of the color transfer function; second, Draw Annotations is unchecked in the Color Legend Parameters dialog (as explained earlier).
The Add active values button can be used to fill the annotations widget with unique discrete values from the data array, is possible. Based on the number of distinct values present in the data array, this may not yield any result (instead a warning message will be shown).
Still to come…
In the next post, we will take a look at categorical color maps.