Visualization, Analysis, and Workflows Over the Web for Geosciences Using UVCDAT, VTK, and VisTrails

Kitware and NYU-Poly have been working together on the development of open-source tools and libraries to make it easier for developers to provide sophisticated, interactive geoinformatics over the web. Kitware and NYU-Poly, along with help from climate scientists from National Labs and NASA, are collaborating on ClimatePipes [1] project, the goal of which is to enable climate data access, analysis, and visualization over the web for masses. The work performed for ClimatePipes has resulted in front-end libraries written primarily using JavaScript with minimal dependencies such as JQuery and D3. For the backend, we use Python as our programming language because of its popularity, easy of use, and availability of bindings to VTK [2], UVCDAT [3], and many other computing and analysis libraries. Currently, the backend library uses VTK and UVCDAT primarily for data processing and analysis.

Figure 1: ESGF precipitation data displayed over OpenStreetMap in ClimatePipes. The info box displays
the value and specific location, displayed by clicking on a point of interest.
In the next few sections, we will provide an overview of some of these libraries with details on some of the core features currently supported by them.
GeoJS: Geovis Library for the Web
As the name suggests, the GeoJS library is developed using JavaScript and provides the high-level API for geoinformatics over the web. GeoJS's primary functionality is to deliver WebGIS using the latest Web 2.0 technologies such as 2D Canvas, WebGL [4], and HTML 5.0. For the most part, the API provided by GeoJS should look familiar to developers with a WebGIS or traditional GIS background. GeoJS provides a layer-based API in which a layer can contain one or more geometries. The layers are arranged in a stack layout in which the layer on top of the stack is drawn last by the renderer. Figure 2 shows the technology stack for GeoJS.
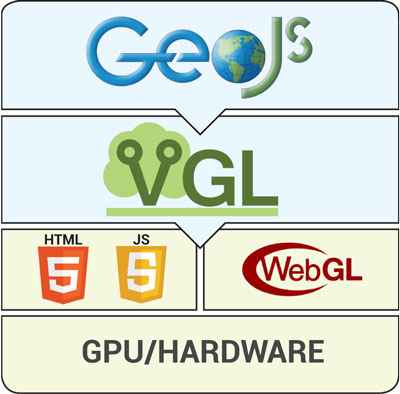
Figure 2. GeoJS technology stack
GeoJS is built on top of VGL, the rendering library of ClimatePipes. VGL provides a high-level API for scene construction and management. Most of the implementation for VGL is borrowed from our previous work on
VES [5]. As of release 0.1 of GeoJS, the following core features are supported:
• Render order based on the position of the layer in the stack
• Animations for a one or more layers
• Map layer using OpenStreetMap datasets
• Data query / picking using mouse clicks
• Workflows API and editor
Apart from these core features, many other essential features are supported. Currently GeoJS supports reading data in the GeoJSON format, and we are planning to add support for reading Shapefile in the near future. In this article, we will focus on two of the core features of GeoJS: workflows and provenance.
Workflows and Provenance
Two of the important features supported by GeoJS are workflows and provenance. The backend for workflows and provenance uses the VisTrails [6] workflow and provenance management software to perform the analysis and data operations needed by the front end. The workflows primarily have two components. In the backend, running the workflow through VisTrails performs computation and algorithmic operations on the data. In the front end, GeoJS provides a web-based workflow editor to visualize and interact with the workflows.
The workflow component of the GeoJS library contains classes to draw and interact with a workflow. The workflow is drawn on the 2D context of an HTML5 canvas using basic drawing primitives. Unlike the VisTrails workflow editor, inputs exist directly in the modules, allowing users to set and change parameters of the workflow. These inputs are standard html input elements that hover over the canvas in the DOM. The workflow editor consists of a list of modules on the right, the main workspace to the left of the modules list, and a few buttons along the bottom. Modules can be dragged from the list on the right into the main workspace area, which instantiates a new instance of that module. Initiating a drag operation from an output port of one module to an input port on another creates connections between modules. Modules can be selected by a mouse click, upon which the module gets highlighted with a yellow border. Clicking and dragging a module moves it about the canvas. Clicking and dragging on the blank canvas pans the view. Selecting them and clicking the delete button can delete modules.
As mentioned earlier, GeoJS uses VisTrails python API at the backend. A trimmed down version of the open-source VisTrails workflow management system is used to execute GeoJS-generated workflows on the server side. VisTrails workflows can be exported and imported as XML. Using this functionality enable us to generate workflows on the front end in JSON, send them to the server, serialize them as XML, import them into VisTrails, execute them, and send the results back to the Web client. Any libraries that can run on VisTrails can be utilized by our system in this way.

Figure 3. An example workflow that performs a 10-year average on
climate datasets from remote or locations. The variable module is selected here.
VGL: OpenGL Visualization Library
VGL is developed in response to the interactive rendering requirements of ClimatePipes. We chose to develop VGL to deliver a lightweight, extensible, and open-source library for enabling developers to build high-performance, interactive visualization applications on the web clients. Most of the existing libraries are either focused on games and animations or lack the performance required to render large dataset on the web browser. As shown in Figure 4, the VGL library is composed of multiple components, each of which offers a unique feature within the library.

Figure 4. Technology stack of VGL
The next section provides details on SceneGraph and Rendering Pipeline of VGL.
SceneGraph and Rendering Pipeline
The VGL library uses scene graph data structures to manage scenes efficiently. A scene graph is a data structure that provides spatial and logical relationships between various entities of a scene. A scene graph can be implemented in many ways, and some of the open-source implementations of a scene graph are inspired by the design of OpenGL Performer, one of the well-known scene graph libraries from SGI [7]. The VGL library is built using the same core principles and additionally provides a consistent, easy-to-use API to allow applications to take advantage of programmable pipeline functionality of WebGL.
Like VES, VGL separates the geometry from the material. A material defines the look and appearance of the geometry. Since it’s desirable to share same material between different geometries, VGL provide the material API on the vglNode and not on vglMapper since a node (for example a vglGroupNode) can have one or more mappers via child actor nodes (vglActor). In this way a material can be shared between different mappers and the rendering can be grouped together by the material used by the node in order to minimize OpenGL state changes for maximum performance.
In WebGL, it is necessary to provide a vertex and a fragment shader in order to render geometry primitives (See Figure 6). Vertex shaders can be used for traditional, vertex-based operations such as transforming the position with a matrix, computing the lighting equation to generate a per-vertex color, and generating or transforming the texture coordinates. The fragment shader is a general-purpose method for interacting with fragments. VGL provides a consistent API for applications to pass vertex and fragment shaders to the programmable pipeline. Also, as shown in Figure 5, the pipeline requires uniforms and attributes to be passed to the shaders. VGL hides all the complexities of the OpenGL pipeline and provides an easy to use API for both uniforms and vertex attributes.
Another feature delivered by VGL is its flexible, OpenGL-friendly geometry data structure for maximum performance and portability. VGL provides a very flexible data structure for defining geometry for the purpose of rendering. Some of the highlights of the VGL library geometry data are:
• Support for interleaved or separated data arrays
• Any number of coordinate systems for the point data
• Support for different basic types for the point data
• Separation of point data from the cell data
• Extensible data structure
VGL geometry data structure is composed of one or more sources (arrays). These sources when combined with primitive types define attributes of the vertices such as positions, colors, or user defined attributes.

Figure 6. Simple overview of WebGL programmable pipeline
Conclusion & Future Work
In this article, we presented an overview of the GeoJS and VGL library for the purpose of visualization and analysis over the web that uses UVCDAT, VisTrails, and VTK on the backend. We are extremely delighted by results despite some challenges with developing and testing large code base using JavaScript. We are hoping to further improve the code base, adding new features, testing the code thoroughly, and releasing the source code frequently as part of the ClimatePipes project.
Acknowledgements
Many thanks to Dean Williams, Charles Doutriaux from LLNL, Berk Geveci from Kitware, Claudio Silva from NYU-Poly, Thomas Maxwell and Gerald Potter from NASA for their support and encouragement.
The work is performed under DOE SBIR Phase II (DE-SC0006493).
References
- User Friendly Climate Data Visualization and Analysis,
- https://climatepipes.kitware.com
- Visualization Toolkit (VTK), http://vtk.org
- Ultrascale Visualization and Analysis Toolkit (UVCDAT), http://www.uv-cdat.llnl.gov
- WebGL, OpenGL ES 2.0 for the web,
- http://www.khronos.org/webgl
- VES, http://www.ves.vtk.org
- Bavoil, L. et al. VisTrails: enabling interactive multiple-view visualizations. VIS 05 IEEE Visualization 2005 2005, 135-142 (2005).
- OpenGL Performer, http://oss.sgi.com/projects/performer

Aashish Chaudhary is an R&D Engineer on the Scientific Computing team at Kitware. Prior to joining Kitware, he developed a graphics engine and open-source tools for information and geo-visualization. Some of his interests are software engineering rendering, and visualization.

Ben Burnett is a senior software developer in the vgc research group at NYU Poly. He received his M.S. in Computing from the University of Utah where he focused on Data Management and Analysis.

Chris Harris is an R&D Engineer at Kitware. Chris's background includes middleware
development at IBM, and working on highly-specialized, high performance, mission critical systems.

David E. DeMarle is a member of the R&D team at Kitware where he contributes to both ParaView and VTK. He frequently teaches Kitware's professional development and training courses for these product applications.

Daniel Kohler Osmari received his B.S. in Computer Science from Universidade Federal do Rio Grande do Sul (UFRGS) working with GPU programming; he's currently a M.Sc. student at Polytechnic Institute of New York University (NYU-Poly) working on information visualization and high performance computing.