Helping a Conference Go Virtual: Kitware’s Computer Vision Team Creates Visualizations for CVPR 2020
CVPR, the IEEE/CVF Conference on Computer Vision and Pattern Recognition, is the world’s premier annual computer vision event. Kitware has been a major contributor to the CVPR community, so we were honored to have members of Kitware’s Computer Vision and Data and Analytics Teams develop the visualizations on CVPR’s website illustrating subject areas for accepted papers. To learn about the many other ways we are involved in CVPR this year, visit our CVPR 2020 blog.
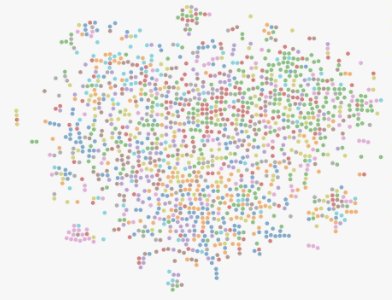
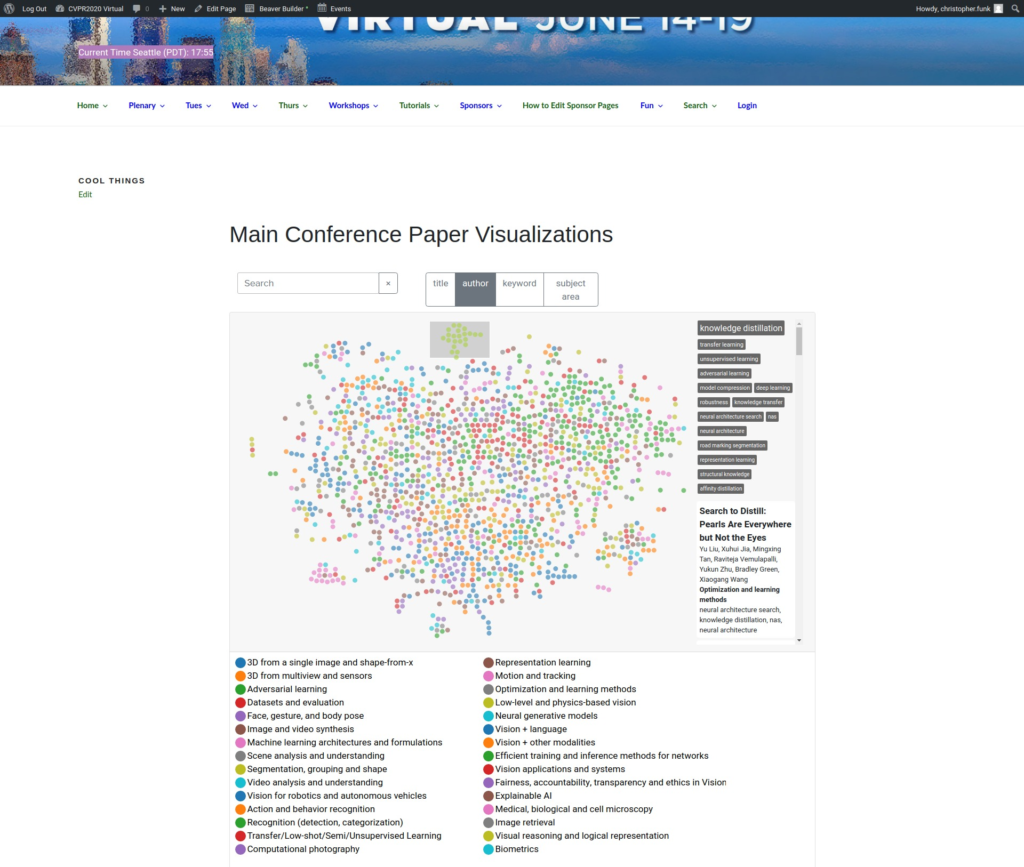
The first visualization Kitware developed is a scatterplot representing the distribution of subject areas of accepted papers at the conference, see Image 1. Each dot represents a paper and the color of the dot represents the subject area. The papers are arranged by a measure of similarity based on their abstracts. The abstracts were converted to feature vectors using a BERT-based natural language model that was created specifically for sentence embeddings[1] utilizing the huggingface repo. Each abstract was tokenized, run through the model, and its feature vector was extracted from the mean of the final hidden states. A T-SNE reduction using cosine distance as the dissimilarity metric was used to reduce each high-dimensional feature vector into 2D space. These 2D points are shown in the scatterplot. D3 was used to render the plot and make it interactive. We created visualizations for both the main conference and workshops.
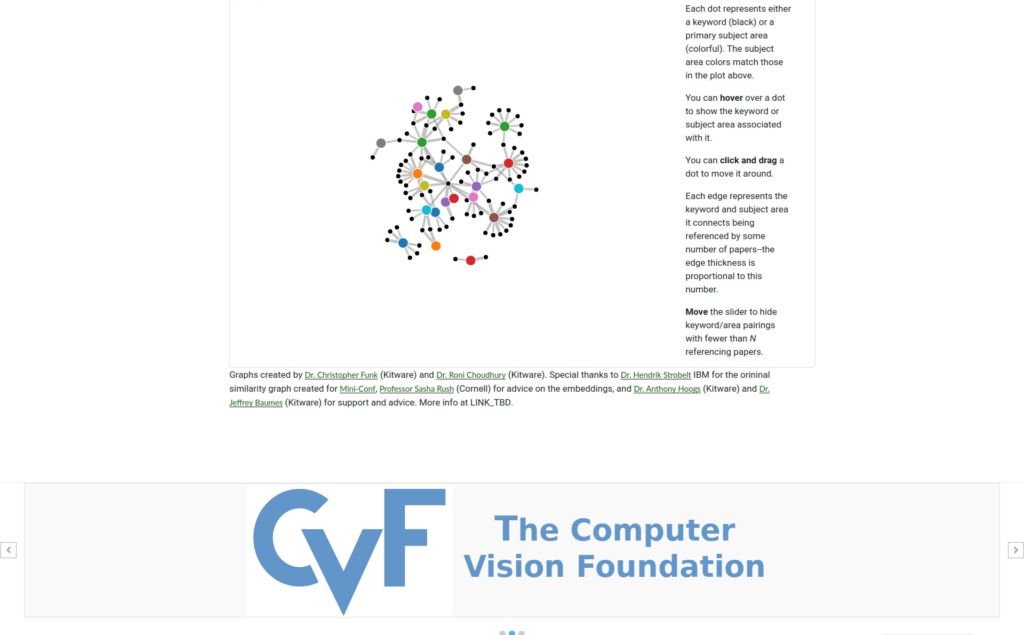
The second visualization is a force-directed graph that shows connections between keywords and primary subject areas, see Image 2. A link represents papers containing a unique keyword/subject area pair. The link weight is proportional to the number of papers with that pair. There is gravity which is pulling all nodes to the center and collision detection between the nodes pushing them apart and the user can pull the nodes around while exploring the graph. D3 was also used to render this plot and make it interactive.
View the interactive visualizations here.
These visualizations were made by Dr. Christopher Funk, who is part of Kitware’s Computer Vision Team, and Dr. Roni Choudhury, who is part of Kitware’s Data and Analytics Team. Special thanks to Dr. Hendrik Strobelt (IBM) and Professor Sasha Rush (Cornell) for sharing the initial code to create this visualization in javascript that was adapted from their virtual conference toolkit, MiniConf, and for the suggestion of the network used for the abstract feature embeddings. Thank you to Dr. Anthony Hoogs, Senior Director of Computer Vision for Kitware, and Dr. Jeff Baumes, Director of Data and Analytics for Kitware, for their helpful suggestions and support.
[1] Reimers, Nils and Gurevych, Iryna. “Sentence-BERT: Sentence Embeddings using Siamese BERT-Networks”. Empirical Methods in Natural Language Processing. 2019. http://arxiv.org/abs/1908.10084