VTK’s Second Google Summer of Code

This year, the Visualization Toolkit (VTK) was accepted to participate as a “mentoring organization” in Google Summer of Code (GSoC). This is VTK’s second time taking part in the program, which fosters student participation in open source communities, encouraging them to immerse themselves in an open-source project for the summer.
VTK first participated in GSoC in 2011, for which Tharindu De Silva’s proposal “Implement Select Algorithms from IEEE VisWeek 2010 in VTK” and David Lonie’s proposal “Chemistry Visualization” were selected. Tharindu focused on implementing a selection of the most popular algorithms from IEEE VisWeek 2010 in VTK, and David improved support for rendering structural chemical data, including standard molecule representations. The year after VTK’s first GSoC, David was hired as an R&D engineer on Kitware’s Scientific Computing team, to continue work on VTK as well as the Open Chemistry project.
Marcus Hanwell, a Technical Leader at Kitware who took part in GSoC 2007 as a student, has served several times in GSoC as a mentor and as VTK’s organization administrator. As a student, Marcus’ project focused on developing the open-source Avogadro and Kalzium projects to provide 3D molecular editing capabilities in Kalzium, a KDE educational project.
This year, 190 organizations were selected out of 371 applications to participate in the program. Students were asked to submit proposals to work with the selected organizations on open-source projects. VTK offered students example project ideas, which included Supporting a Visualization Grammar, Biocomputing In Situ Visualization, and Improving Hardware Volume Rendering Support. Students were also encouraged to submit their own project ideas.
There were many strong proposals, and Kitware’s mentors/administrators selected three of them. Throughout the program, the mentors guided students in developing their projects and in participating in the VTK community.
Ensemble Vector Fields for VTK
Kitware was pleased to have Summer of Code student Brad Eric Hollister work on the project “Ensemble Vector Fields for VTK” with Berk Geveci.
The vtkEnsembleSource class, newly added to VTK, manages a collection of data sources in order to represent a dataset ensemble. It has the ability to provide meta-data about the ensemble in the form of a table. Using this new source object and Open MPI/NFS, Brad was able to generate streamline data for a thousand-member vector field ensemble (derived from a two-dimensional lock-exchange simulation with uncertain boundary conditions). Computations were performed on a commodity three-node PC cluster.
The remaining goals of the project were to use the streamline data for finite-time variance analysis (FTVA) and clustering on particle data. Streamline storage amounted to approximately two Terabytes, making further analysis on the available compute cluster inefficient. While CPU parallelization over the ensemble was straightforward and provided execution time benefits, storage on a single hard-drive caused an I/O bottleneck when parallelizing computation over the spatial field for FTVA. Thus, further work is being conducted by Brad to successfully complete a full-field FTVA rendering (over multiple integration steps). This work entails writing streamline data to storage that minimizes file reads by analytical methods. The streamline data should be split over multiple I/O devices, either in a RAID or other configuration, for parallel I/O.
Extensions for Geospatial and Climate Based Visualization in VTK
For the project “Extensions for Geospatial and Climate based visualizations in VTK,” Jatin Parekh worked with Aashish Chaudhary to extend geospatial and climate data visualization capabilities in VTK. While VTK provides basic climate data visualization functionality, such as geospatial transformations using PROJ4 and a few readers, it lacked features ideal for geovisualization or geographic information systems (GIS).
This project added new features to VTK, which are described in the following paragraphs. These features will enable developers to combine the scientific and informatics capabilities of VTK with geospatial context and information.
GeoJSON is a format for encoding a variety of geographic data structures. It has become a popular format, especially in the Web community. GeoJSON supports the following geometry types: Point, LineString, Polygon, MultiPoint, MultiLineString, and MultiPolygon.
A GeometryCollection represents a list of geometries, while geometries that have additional properties are Feature objects. As with geometries, a FeatureCollection represents a list of features. Since many datasets are now available in GeoJSON, support for it was added in VTK using the JSONCPP library. This library is already used in VTK for some other parsing operations, and the result of this reader is shown as a series in Figure 1.
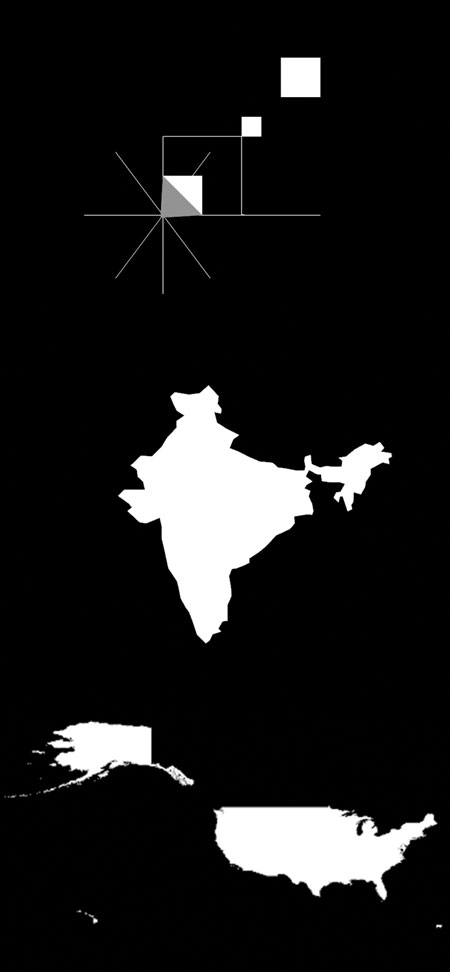
Figure 1. Output of GeoJSON reader rendered in VTK
Similarly, the LAS format is a well-known format for airborne LIDAR data. “A LAS dataset stores references to one or more LAS files on disk, as well as to additional surface features. It is an industry-standard binary format for storing airborne LIDAR data. The LAS dataset allows for fast and simple examination of LAS files in their native format, providing detailed statistics and area coverage of the LIDAR data contained in the LAS files” [1].
For this project, the LibLAS library was utilized to add support for the LAS format in VTK. The output of the LAS reader rendered in VTK is shown in Figure 2.
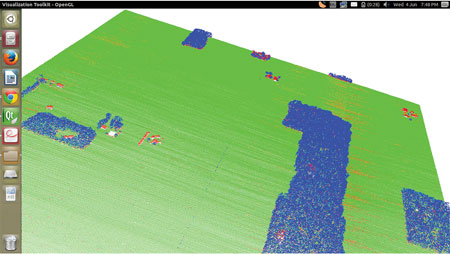

Figure 2. Output of LAS reader rendered in VTK
Any GIS solution expects a layer interface with the base layer rendering map tiles from a configured tile server. Depending on the camera position, the appropriate tiles (images) can be selected from a tile server, if not already cached, and then rendered into VTK at the appropriate locations. For Jatin’s work, he tested and utilized the tiles from the Bing Maps and OpenStreetMap Web map tile services (WMTS). Figure 3 shows a screenshot of this work. He intends to develop a full Map API that can be added to existing VTK applications without too much effort.
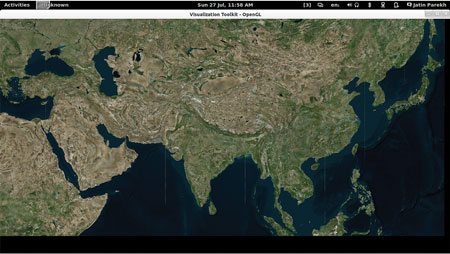
Figure 3. Bing Map tiles rendered in the VTK
Jatin has also worked on contour labelling and adding support for the PostGIS/Postgres database in VTK.
Supporting a Visualization Grammar
Kitware was pleased to have Summer of Code student Marco Cecchetti work on a significant extension to 2D charting in VTK. For his project, “Supporting a Visualization Grammar,” Marco Cecchetti worked with Jeff Baumes.
The aim of this project was to provide the ability to create plots and charts inside the VTK framework with a simple declarative language. In order to achieve this goal, the Vega visualization grammar JSON format was mapped to the VTK infrastructure. Vega can be thought of as a file format for visualizations and a supporting JavaScript rendering engine. It was developed by Jeffrey Heer at the University of Washington. To try it out and download it, please visit http://trifacta.github.io/vega/. The format rolls together data and its mapping to graphical elements to concisely describe very diverse visualizations. For example, the JSON to the right produces the simple bar chart below:
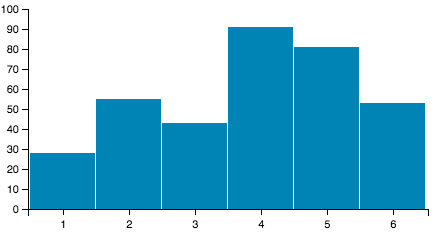
Figure 4. Chart produced by the JSON to the right
The first main component of the GSoC project was to add a utility to VTK that enables conversion from Vega JSON to the graphical primitives needed to render the visualization. The original Vega JavaScript code was leveraged in Qt’s V8 engine to perform this conversion and output the scene. To achieve this outside the context of the normal browser environment, custom handlers were added to support timeouts and other Web-specific functions. The resulting utility, QVegaScene, takes a Vega JSON file as command-line input and outputs a low-level scene graph, also in JSON format.
The second component of the project consisted of rendering code for the resulting scene format. New classes were added to support the Vega graphical primitives inside VTK’s rendering framework including text, symbols, paths, and images. Subclasses of vtkContextItem were used to implement each of these graphical types. A utility VegaChart takes a scene produced by QVegaScene as a command-line argument and renders the resulting chart into a VTK render window.
{
“width”: 400,
“height”: 200,
“padding”:
{“top”: 10, “left”: 30, “bottom”: 30, “right”: 10},
“data”: [
{
“name”: “table”,
“values”: [
{“x”: 1, “y”: 28}, {“x”: 2, “y”: 55},
{“x”: 3, “y”: 43}, {“x”: 4, “y”: 91},
{“x”: 5, “y”: 81}, {“x”: 6, “y”: 53}
]
}
],
“scales”: [
{
“name”: “x”,
“type”: “ordinal”,
“range”: “width”,
“domain”: {“data”: “table”, “field”: “data.x”}
},
{
“name”: “y”,
“range”: “height”,
“nice”: true,
“domain”: {“data”: “table”, “field”: “data.y”}
}
],
“axes”: [
{“type”: “x”, “scale”: “x”},
{“type”: “y”, “scale”: “y”}
],
“marks”: [
{
“type”: “rect”,
“from”: {“data”: “table”},
“properties”: {
“enter”: {
“x”: {“scale”: “x”, “field”: “data.x”},
“width”:
{“scale”: “x”, “band”: true, “offset”: -1},
“y”: {“scale”: “y”, “field”: “data.y”},
“y2”: {“scale”: “y”, “value”: 0}
},
“update”: {
“fill”: {“value”: “steelblue”}
},
“hover”: {
“fill”: {“value”: “red”}
}
}
}
]
}

Figure 5. Examples of fully VTK-rendered Vega specifications
To try out this experimental feature, check out Marco’s branch on GitHub at https://github.com/mcecchetti/VTK/commits/feature/qt-vega. For more information on this Summer of Code project, see Marco’s log at [2].
Conclusions
Participating in GSoC has been a valuable experience for Kitware, and the students’ projects have contributed greatly to VTK. We would like to thank Brad, Jatin, and Marco for their hard work and contributions. The GSoC projects have not only resulted in new contributions to VTK, but they have offered us the opportunity to explore new directions with talented students. This gives the community a source of fresh ideas and exposes our students to a large open-source project.
We hope that Brad, Jatin, and Marco found the experience enriching, and we thank Google for selecting VTK as a mentoring organization.
We will be sending delegates from VTK to the mentor summit in Mountain View, CA, and look forward to exchanging ideas with other organizations later this year. We also look forward to taking part in future GSoC’s. We wish our students every success in their future endeavors and will continue to look for more ways to engage with the wider open source and scientific communities to grow the VTK project.
References
1.http://resources.arcgis.com/en/help/main/10.1/index.html#//015w00000057000000?
2. https://stackedit.io/viewer#!provider=gist&gistId=7bb5b605a88ff18a1832&filename=logbook-gsoc2014.

Marcus D. Hanwell is a Technical Leader on the Scientific Computing team at Kitware, where he leads the Open Chemistry effort. He has a background in open source, open science, physics, and chemistry. He has worked in open source for over a decade.

Jeff Baumes is a Technical Leader at Kitware, where he is focuses on informatics and information visualization. Jeff has a background in computer science and mathematics. His Ph.D. thesis topic was “Discovering Groups in Communications Networks.”

Aashish Chaudhary is a Technical Leader on the Scientific Computing team at Kitware. Prior to joining Kitware, he developed a graphics engine and open-source tools for information and geo-visualization. His interests include software engineering, rendering, and visualization.

Berk Geveci is the Senior Director of Scientific Computing at Kitware. He is one of the lead developers of the ParaView visualization application and the Visualization Toolkit (VTK). His research interests include large scale parallel computing, computational dynamics, finite elements, and visualization algorithms.