
Why is ParaView using all that memory?

ParaView is not a small project. It includes over 3 million lines of C and C++ code and 250,000 lines of Python with a smattering of other languages such as FORTRAN, Tcl, and Java (accoring to the wonderful sloccount tool) in its build, and the build has more than 18,000 things to do when Python bindings are enabled. When loading it up to use for handling data on a super computer, its memory footprint seem to be gargantuan.
In a CoProcessing module, just loading up ParaView shoots your virtual memory space up by 500MB. But what is actually taking up all of this memory when the build artifacts only take up a total of 150MB? To find out, we need to dig into how a kernel (specifically, Linux here) does its memory accounting.
First, I'll go over the methods used to find out memory usage and what is using it. On Linux, there is a filesystem called procfs mounted at the /proc directory. This filesystem is implemented with a little bit of kernel knowledge and magic to allow you to introspect what is going on in a process. Here, the two files which are important to us are the status and maps files. The status file contains things like memory usage, historical memory usage, signal masks, capabilities, and more. The maps file contains a list of all of the memory regions mapped to a process, their permissions, and what file they come from. Information on other files may be found in the proc(5) manpage. To find out how much memory ParaView is causing a process to consume, I used a small CoProcessing module and modified it to initialize ParaView and then print out its accounting information from /proc/self/status and /proc/self/maps.
First, looking at the status file, we see something like (trimmed for brevity):
% cat /proc/self/status | head -n 7

Name:   cat

State:  R (running)

Tgid:   16128

Ngid:   0

Pid:    16128

PPid:   15490

TracerPid:      0
This file is where we can get statistics on our process directly from the kernel such as its name, whether it is waiting on I/O, sleeping, or running, permission information, signal masks, memory usage, and more. The field we are interested in here is VmPeak which is the value you usually see in top under VIRT and always seems so high. This value is the most memory that the process ever had mapped for it over its lifetime. For the example here, I get:
VmPeak: 107916 kBNow, you may as "Really? 100MB for cat?". It may seem like a lot, but we can see where it comes from using the maps file. Let's see where it's all going:
% cat /proc/self/maps | awk -f range2size.awk149152 r-xp 00000000 08:13 787901 /usr/bin/cat
4096 r--p 0000b000 08:13 787901 /usr/bin/cat
4096 rw-p 0000c000 08:13 787901 /usr/bin/cat
135168 rw-p 00000000 00:00 0 [heap]
106074112 r--p 00000000 08:13 804951 /usr/lib/locale/locale-archive
1785856 r-xp 00000000 08:13 787887 /usr/lib64/libc-2.18.so
2097152 ---p 001b4000 08:13 787887 /usr/lib64/libc-2.18.so
16384 r--p 001b4000 08:13 787887 /usr/lib64/libc-2.18.so
8192 rw-p 001b8000 08:13 787887 /usr/lib64/libc-2.18.so
20480 rw-p 00000000 00:00 0
131072 r-xp 00000000 08:13 786485 /usr/lib64/ld-2.18.so
12288 rw-p 00000000 00:00 0
4096 rw-p 00000000 00:00 0
4096 r--p 0001f000 08:13 786485 /usr/lib64/ld-2.18.so
4096 rw-p 00020000 08:13 786485 /usr/lib64/ld-2.18.so
4096 rw-p 00000000 00:00 0
139264 rw-p 00000000 00:00 0 [stack]
8192 r-xp 00000000 00:00 0 [vdso]
4096 r-xp 00000000 00:00 0 [vsyscall]We can see here that the vast majority is that /usr/lib/locale/locale-archive file (which we can avoid; see below). After that, it's mostly the C library and the linker which are unavoidable for the most part. Other things to take note of are the special [heap], [stack], [vdso], and [vsyscall] sections. The first two should be fairly obvious, but the other two are created by the kernel and those are the pages where the code which actually talks to the kernel lives. The other field which interests us is the second one which is the permission bits for that section of memory. The "r-xp", "rw-p", and "r--p" pages are fairly standard (executable code, writeable memory, and read-only data memory). The oddball one is that one "---p" sections which is pretty large (two megabytes). This memory is used to help catch buffer overflows from trampling over the code and to assist in aligning memory to ease sharing across processes and are created by the binutils toolchain to separate the code section (r-xp) from the writeable data section (rw-p) in shared libraries. On a 64 bit x86 machine, each library uses 2MB for this buffer which seems like a lot until you realize that the memory is never actually realized in silicon (since any use causes a segfault) and 64 bit machines have access to at least 256TB of virtual memory to play with (and can be extended to the full 16EB if the need ever arises). On 32 bit machines, this is gap is instead 4 KB since the address space is at a much higher premium.
Now that we have some tools at our disposal to try and figure out where our memory is going, let's look at ParaView itself.
The data here was gathered using a CoProcessing module which loaded up ParaView, dumped the information from the status and maps files, then quit. This gives us a good idea of how much memory using ParaView is costing us without getting any datasets thrown into the mix.
Doing this, the maps data was massaged using the following bit of shell code:
awk '{ split($1, range, "-"); $1 = strtonum("0x" range[2]) - strtonum("0x" range[1]); total[$2] += $1 } END { for (perm in total) { print perm ": " total[perm] } }' < maps | sort -k1This code uses awk to compute the size of the memory range from the first field then accounts that size to the total amount of memory for a given set of permission bits. At the end, it prints out the total amount of memory for each set of permissions and then sorts it. Doing this for a build gives us output like:
---p: 79581184

r--p: 106364928

r-xp: 12341248

rw-p: 15507456
From this, we can see that almost 80MB of that buffer memory, 106 MB of read-only memory, 12 MB of executable code, and 15 MB of writeable memory (this is where static std::string variables since they dynamically allocate their memory). The executable code size isn't going to change much (there's -Os which optimizes for size, but you usually pay for it in performance where loop unrolling really boosts performance). The read-only memory has that pesky locale-archive sitting in there inflating our numbers:
7fdd518fc000-7fdd57e25000 r--p 00000000 08:13 804951 /usr/lib/locale/locale-archiveIt turns out that this is loaded up only when Python is used. Using other tools to find out why it's loaded2, we find that its purpose is to aid the C library when working in different locales (specifically, non-C). It can be skipped by running ParaView with the environment variable LC_ALL set to "C". Doing this gives us the following for the r--p sections:
r--p: 290816Much better. Next on the list is the amount of memory being mapped for those 2MB empty sections. The only way to actually remove them is by patching the linker to either make the sections smaller (which requires patching your toolchain) or to make fewer libraries. The former is out of scope for most users, but the latter could be done by making libraries such as vtkFilters rather than vtkFiltersCore, vtkFiltersGeometry, and so on. However, the easiest way is to use Catalyst builds to just reduce the amount of code and libraries in a build to begin with. By using Catalyst builds, ParaView can be made to use only 40% (the Extras edition which contains data writers) to 50% (for Rendering-Base) of a full build's VIRT memory footprint.
Here is a graph of memory usage when using various build types (shared and static), Catalyst editions (Extras, Rendering-Base, and a full build). All experiments were run with LC_ALL=C to keep the non-Python experiments comparable. Each source tree was built without Python, with Python (+python), and with Python and Unified Bindings enabled (+python+ub). The Python-enabled builds also have experiments showing usage when Python code was actually used rather than just being built-in for the CoProcessing pipeline or not (experiments with an asterisk):
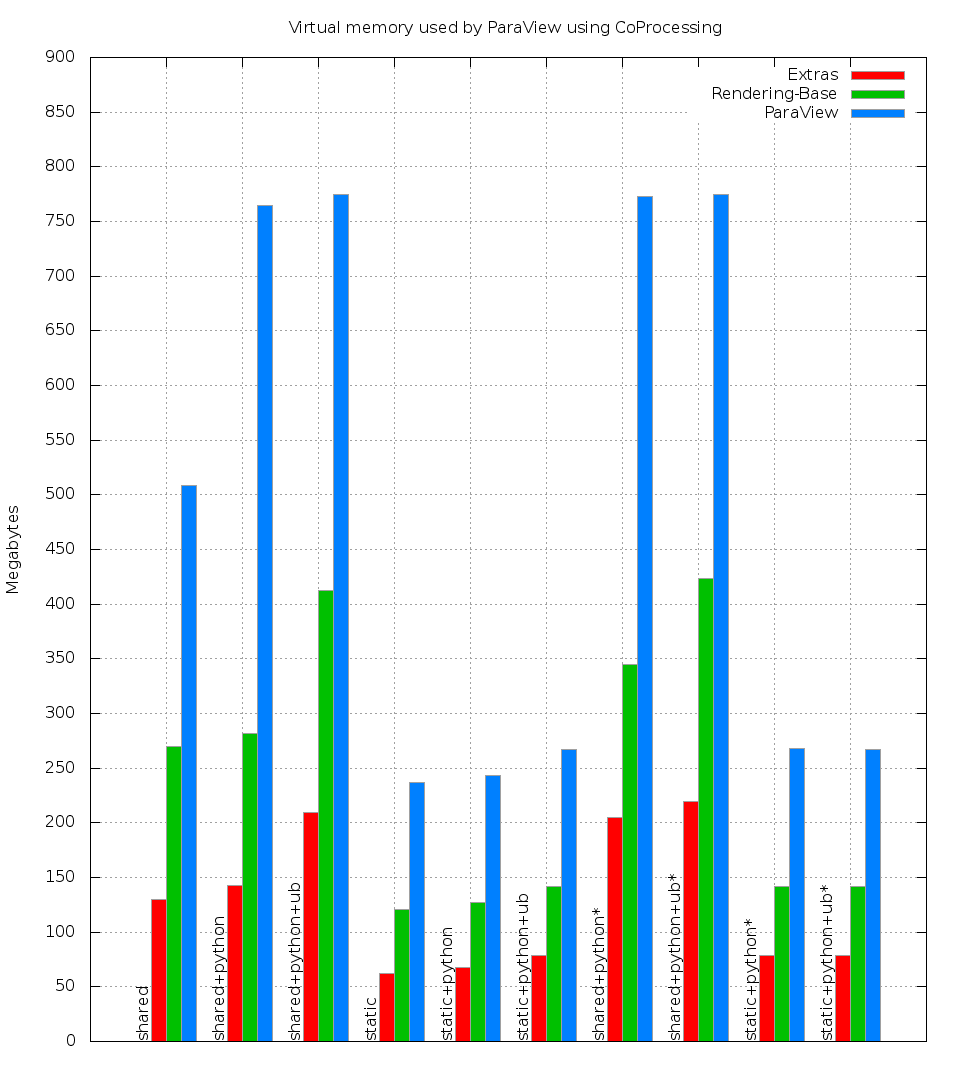
As the graph shows, the Catalyst builds are much smaller than the full builds and get the largest memory usage gains. One thing to note is that if MPI is used, a static build will incur the the amount shown here per process. For shared builds, any memory under the "buf", "data", and "code" sections of the detailed graph (attached, but now shown) should be shareable between processes, so each process after the first only costs the amount of "write" memory for the experiment. Also, if Python is used in the experiment, enabling unified bindings makes the build smaller by removing the need for around four thousand targets to build (for a full ParaView build) to wrap all of the VTK classes a second time. The result is that there is less code at the expense of some more "write" memory (9 MB of code removed for 7 MB or write memory).
1 The range2size.awk file converts the byte ranges into byte sizes to see the sizes more easily.
2The ltrace and strace tools for those interested, but their use is outside the scope of this article.