Interactive Visualization of Google Project Tango Data with ParaView

Introduction
Kitware has been working with the Google Project Tango team to help them create software dashboards with CDash and track algorithm performance over time with MIDAS. Google describes the project as “an attempt to create a mobile device unlike like any other, a mobile device that shares our sense of space and movement, that understands and perceives the world the same way we do.”
As part of the Kitware effort, we were fortunate enough to receive two Project Tango development kits for testing purposes. The dev kits are essentially mobile phones that provide advanced 3D-sensing capabilities for producing colorized point clouds of the environment. After receiving the devices and walking around the office looking at depth maps and point clouds on the device—and taking plenty of selfies—we were excited to view the data in our favorite scientific visualization tool ParaView.
This post describes how to acquire data from a Project Tango development kit and visualize it using ParaView—without writing a single line of code. If you have been lucky enough to get your hands on a demo device, you will learn how to download and view data within ParaView. For everyone else, we have provided links to sample data that you can download and try out.
We plan a series of follow-up posts to cover more advanced interaction and analysis of Tango data using ParaView, VTK filters, and the Point Cloud Library (PCL) filters. Stay tuned.
Installing ParaView with Tango Extensions
In order to easily process Tango data we added a few extra goodies to the standard ParaView installer. These include the ParaView PCL plugin and some extra Tango-specific filters. You can download pre-built binaries using the following links. Once you’ve installed the application you should be able to launch ParaView.
Note on Mac: you can install ParaView in your Applications folder by dragging it to the Application folder link. You can also run ParaView directly by CTRL-clicking and selecting Open.
It is also possible to use these extra goodies with an already-installed version of ParaView, or build everything from source. For now we’ll assume you are using the pre-built binaries.
Capturing Data
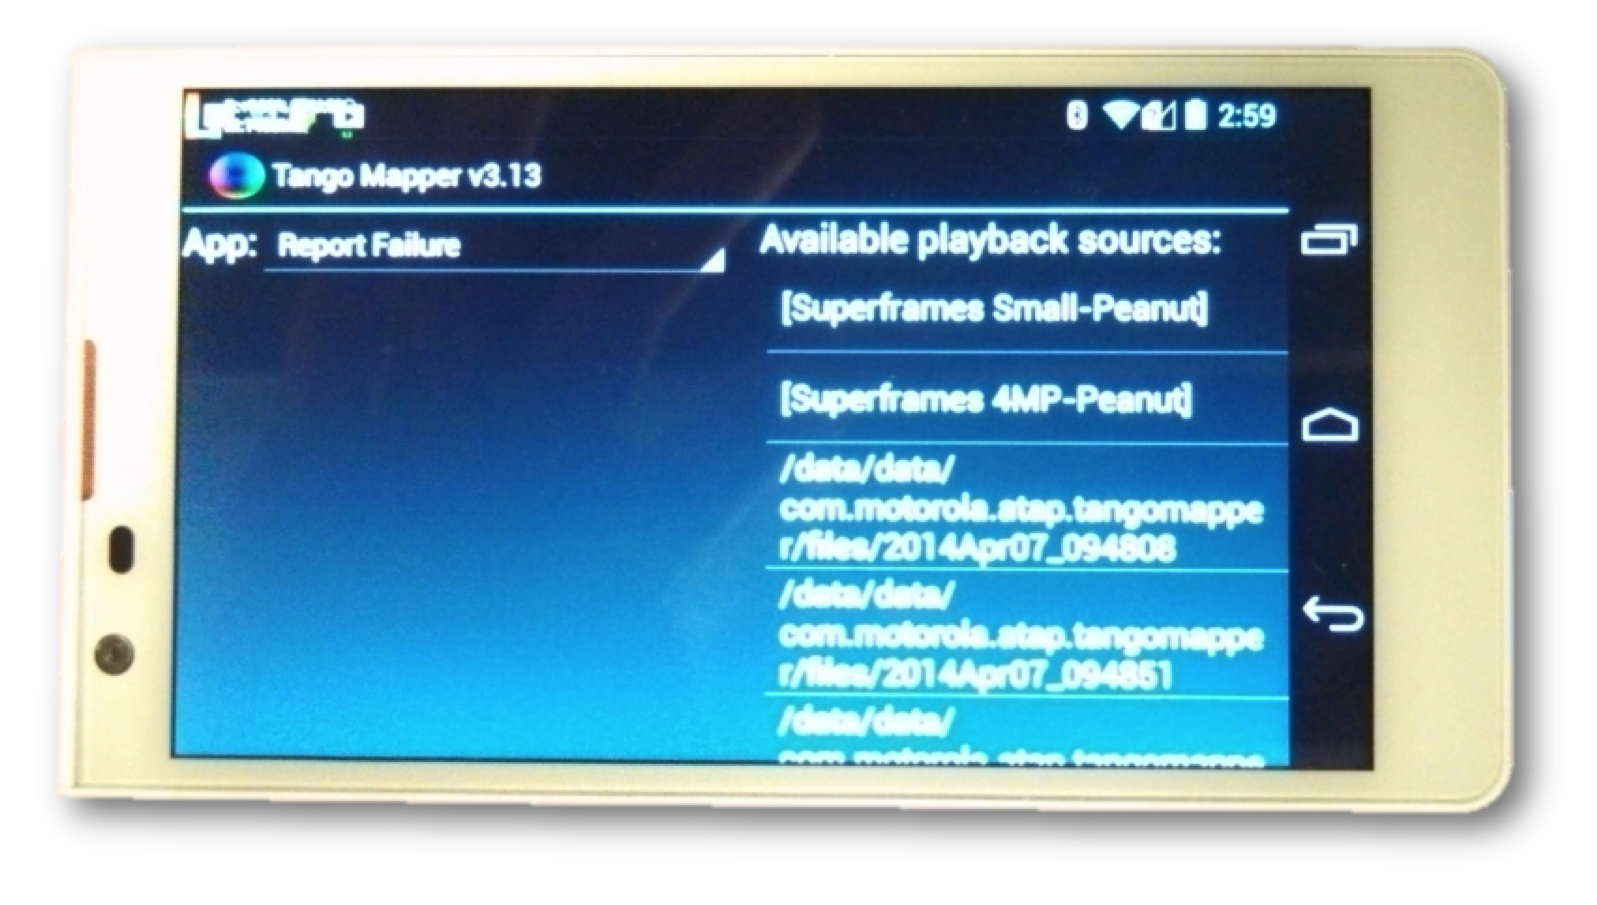
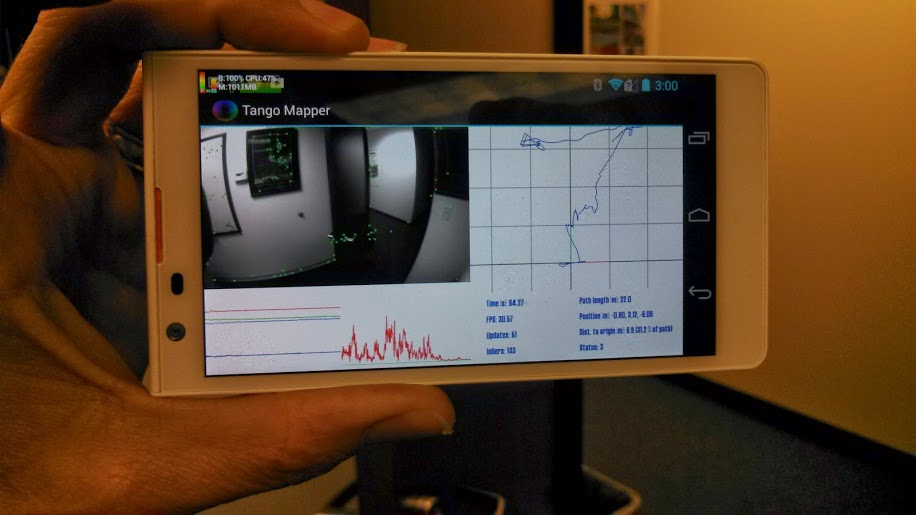
Collecting data with Tango Mapper
You can collect 3D data from the Project Tango development kit using the Tango Mapper application that comes preinstalled on the phone. We ran the application in the Report Failure mode menu option in the upper left on the Tango Mapper screen. Select [Superframes 4MP], then just walked around and point the camera at interesting scenes. When you are done, select the back arrow. This will save the data in /data/data/com.motorola.atap.tangomapper on the device.
Getting the data from the phone to your computer
You will need a working adb executable from the Android SDK. Once you have that, you connect the dev kit to your computer via the USB 3.0 connector. Then you should be able to use adb pull to copy the data directory that you are interested in. You can also use the adb shell for Unix commands like cd and ls to find your data.
Here is a sample adb pull to get the data set in the directory 2014Mar28_114300:
$ adb pull /data/data/com.motorola.atap.tangomapper/files/2014Mar28_114300
pull: building file list…
pull: /data/data/com.motorola.atap.tangomapper/files/2014Mar28_114300/superframes/m0008948.pgm -> ./superframes/m0008948.pgm
pull: /data/data/com.motorola.atap.tangomapper/files/2014Mar28_114300/superframes/m0008947.pgm -> ./superframes/m0008947.pgm
….
At this point you should have all the data from your collect and you should be ready to have a look with ParaView!
Downloading Sample Data
If you can’t get your hands on a device you can download test data here:
- Conference room data set (267MB; unused small frames were removed to reduce file size)
- Smaller skateboard data set (69MB; unused small frames were removed to reduce file size)
After unzipping you will have a folder called tango_20140401 (or 2014Apr10_133430_skateboard if you use the smaller data set). This folder contains the raw data that we collected using the process above.
Visualizing Tango Data with ParaView
To view the Tango data in ParaView, launch ParaView, create a source filter and set its parameters, apply the filter to load the data, and finally animate the view.
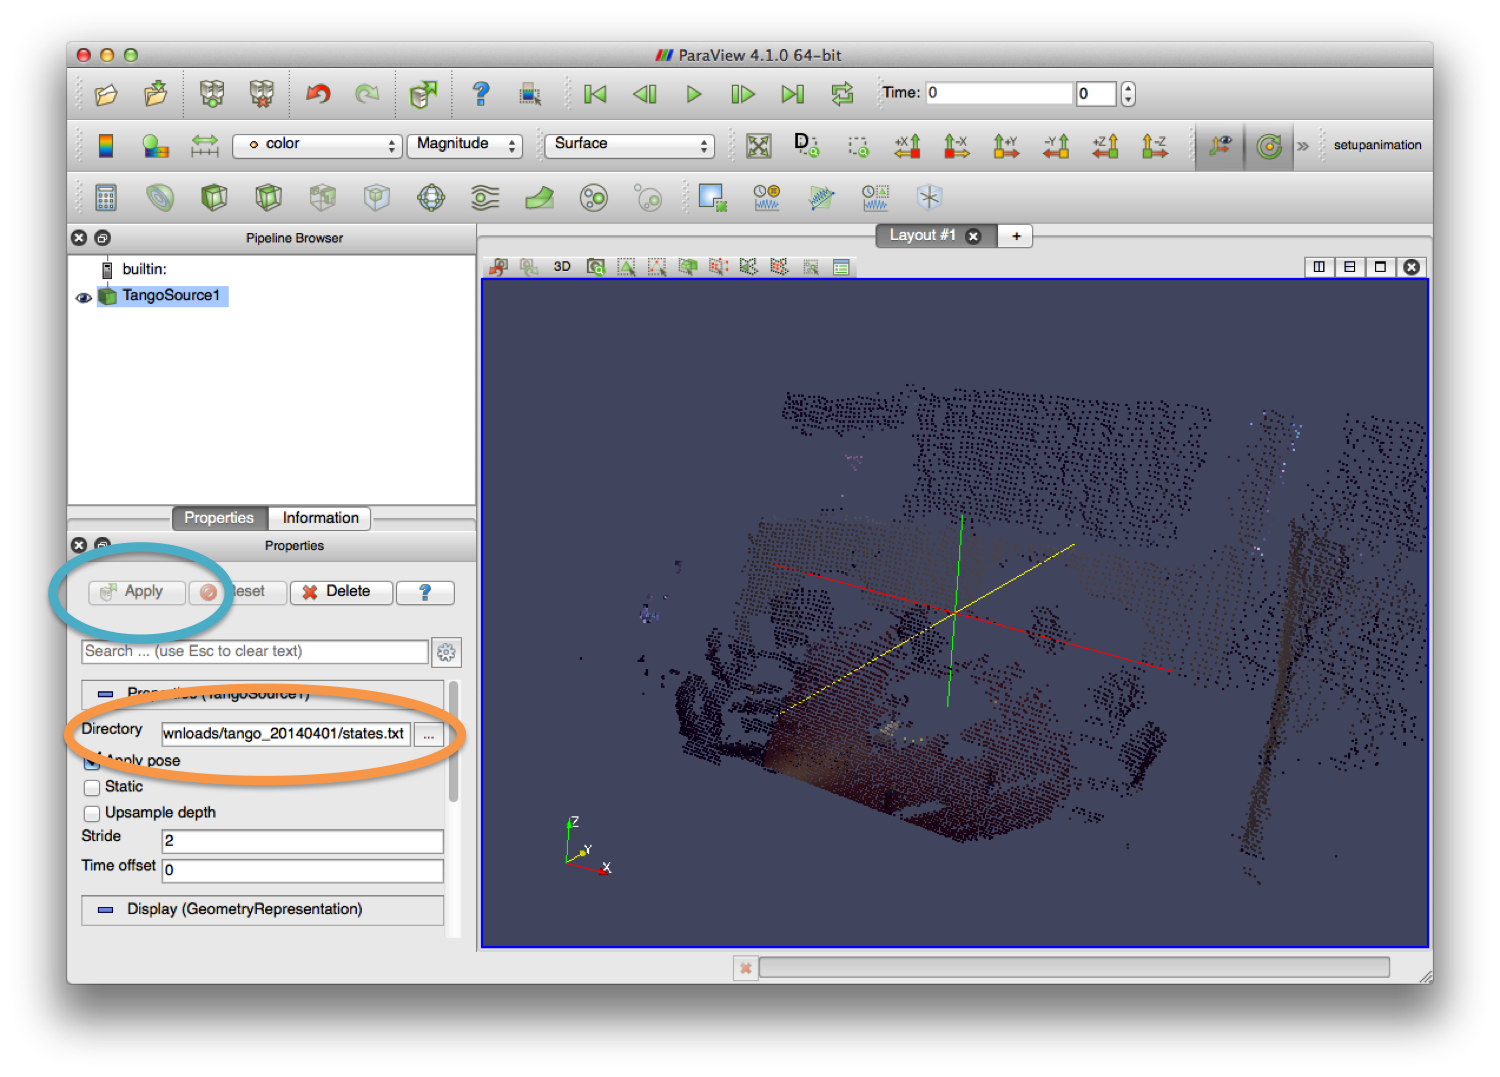
Create a Tango Source Filter
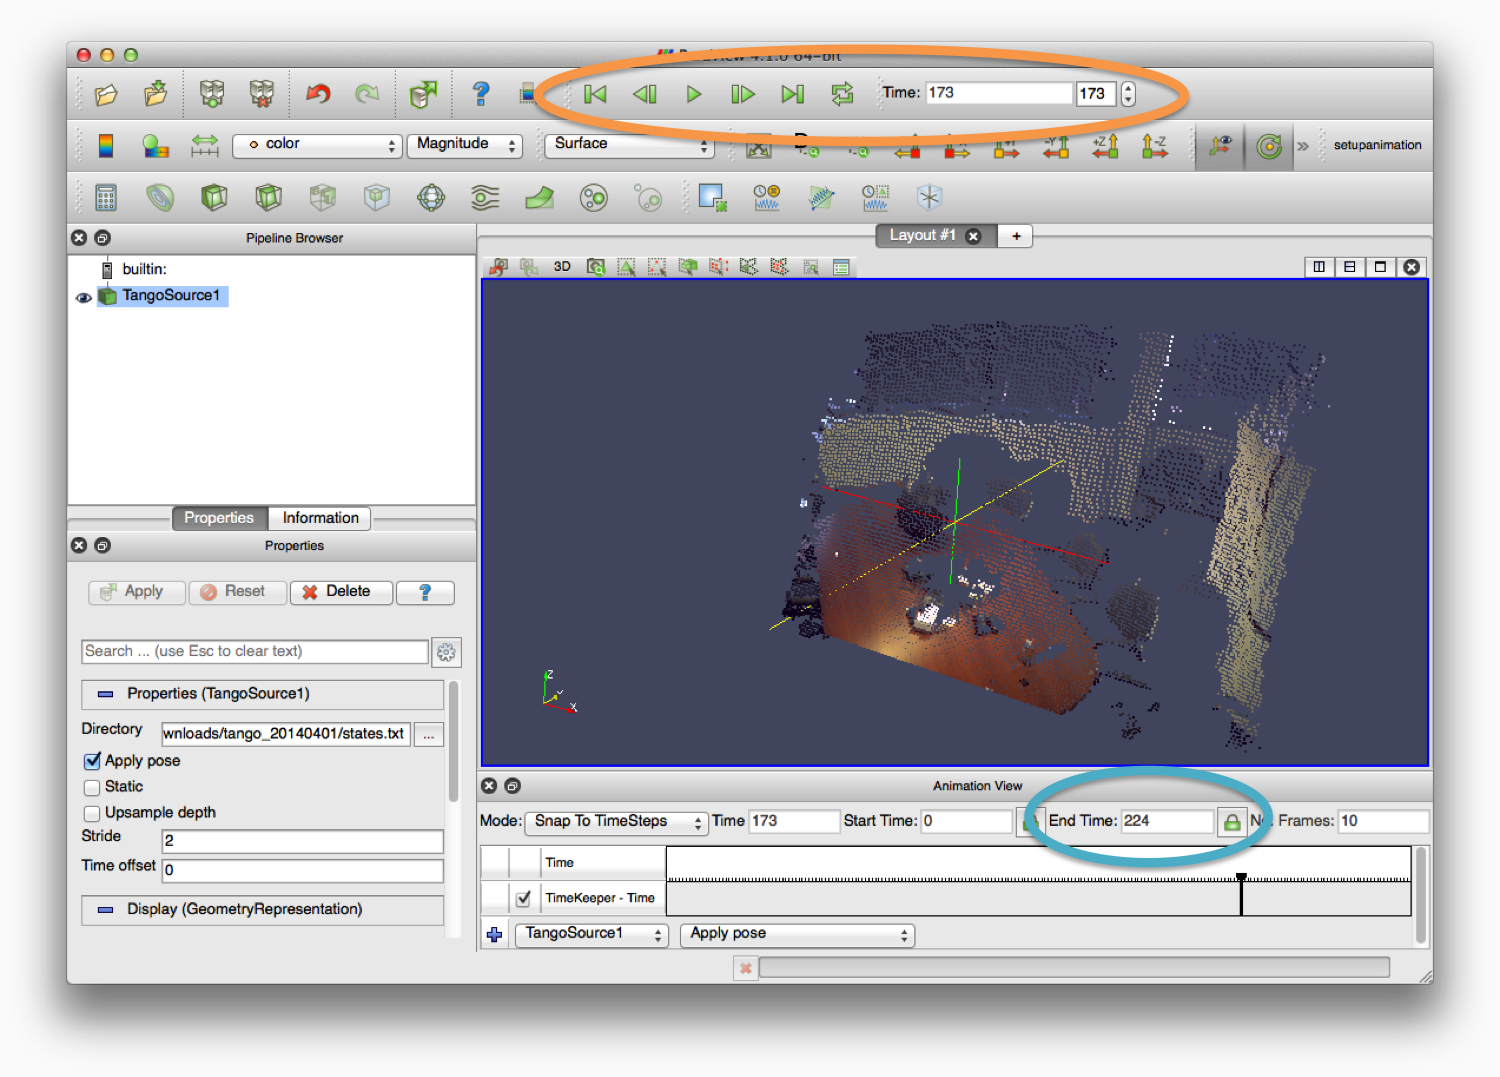
From the Sources menu, select Tango Source. This creates a source filter that will read your Tango data. The parameters for the filter are listed in the lower left of the GUI. Set the Directory parameter to your data directory (e.g., /Volumes/Macintosh HD/Users/davisb/Downloads/tango_20140401). If you use the file open dialog you should pick any file in the data directory (e.g., /Volumes/Macintosh HD/Users/davisb/Downloads/tango_20140401/states.txt). You can ignore the other parameters for now; the defaults are fine.
Load the Data
Now click the Apply button to load the data. After a second or two you will see the first frame of point cloud data. You can use your mouse to interact with the scene (e.g., click and drag will rotate scene and CTRL-click-drag – or right click drag – will scale).
Animate the View
Now start an animation to view all of the recorded point cloud frames. From the View menu, open Animation View. Now you can use the Animation Toolbar at the top of the GUI to play through the frames. The End Time field of the Animation View shows the total number of available frames. Currently, only frames with high-resolution RGB images are available.
A closer look at the Tango Source Options
The Tango Source filter contains several options that you may want to investigate.
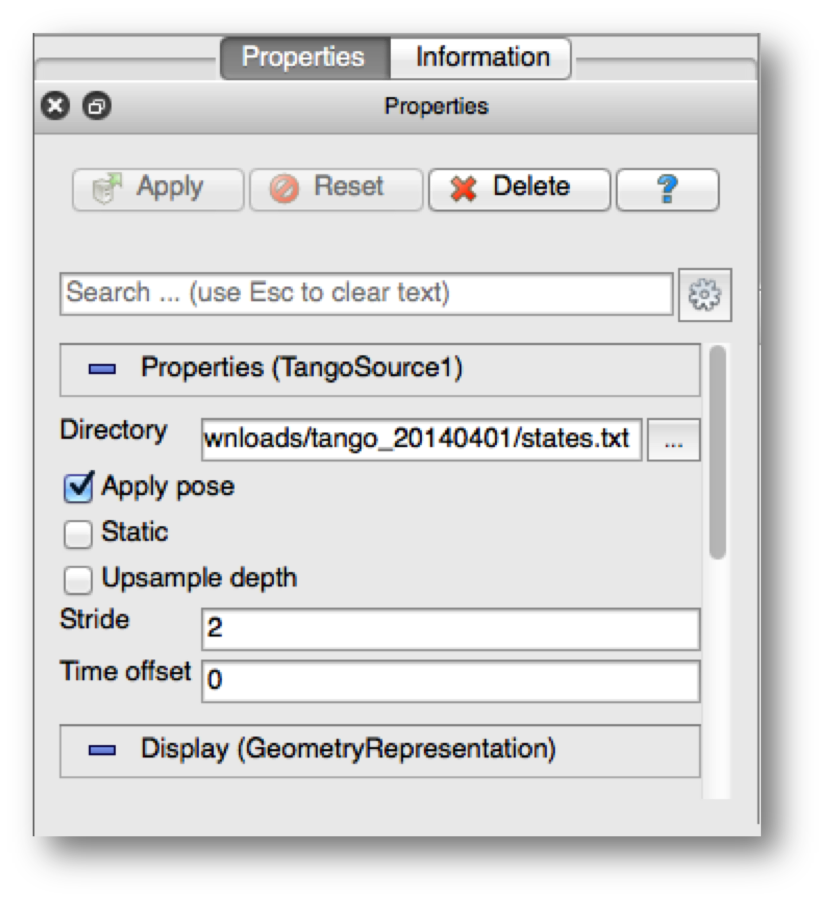
- Directory – the source data location. If you use the “…” file browser button it will require you to select a file rather than a directory; select any file, such as the states.txt file, in the source data directory.
- Apply Pose – If true, apply the reconstructed pose information to the point clouds. If false, the clouds appear in the depth camera’s coordinate system.
- Static – Ignore time information when loading data.
- Upsample Depth – By default the high-resolution image is downsampled to the resolution of the depth-buffer. With this option the depth-buffer is upsampled. Performance of animation playback is slower with an upsampled depth buffer.
- Stride – A non-zero value downsamples the input data by selecting one out of every Stride points. Setting Stride to 1 will load all of the data.
- Time Offset – When the animation view requests data at a given time, provide data at that time plus this offset—used to simultaneously animate different views from multiple sources.
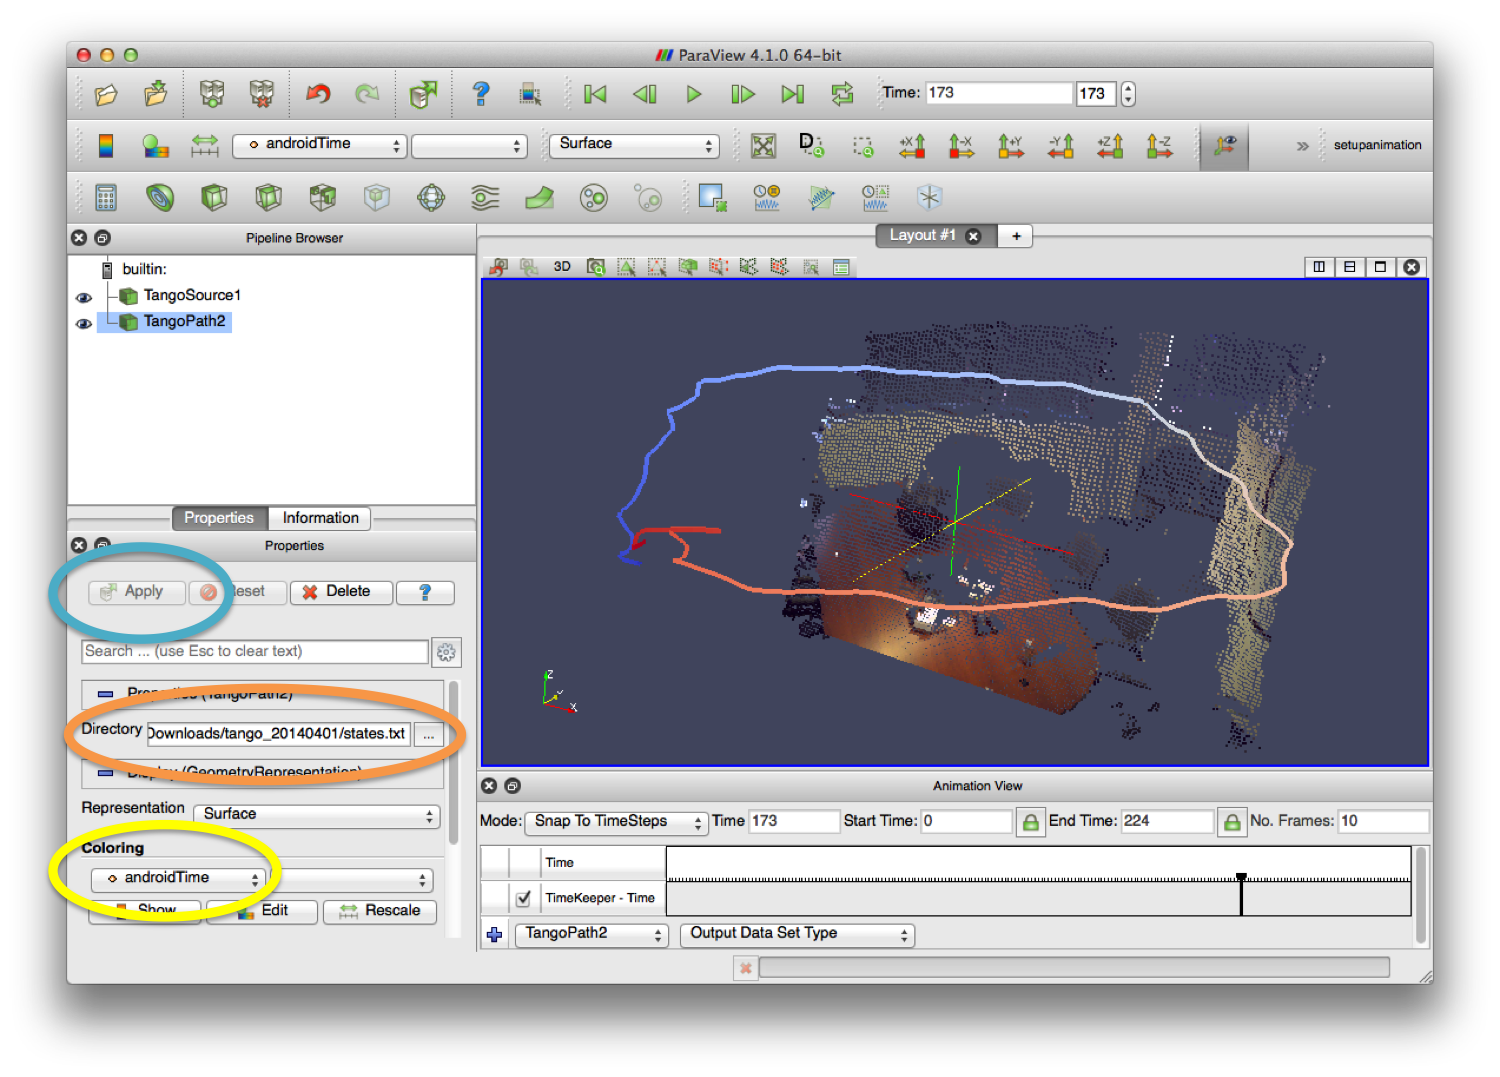
Visualizing the Camera’s Path
In addition to importing point clouds from the depth camera, ParaView’s Tango plugin provides a way to visualize the camera’s motion over time. First, create a Tango Path source by selecting Tango Path from the Sources menu. This source will produce the full sensor path as a line. You will see the new source filter in the pipeline browser. Select the new filter, set the Directory to your data directory (same as for the Tango Source above), and click Apply. To color the sensor path by time, select androidTime using the Coloring drop down menu.
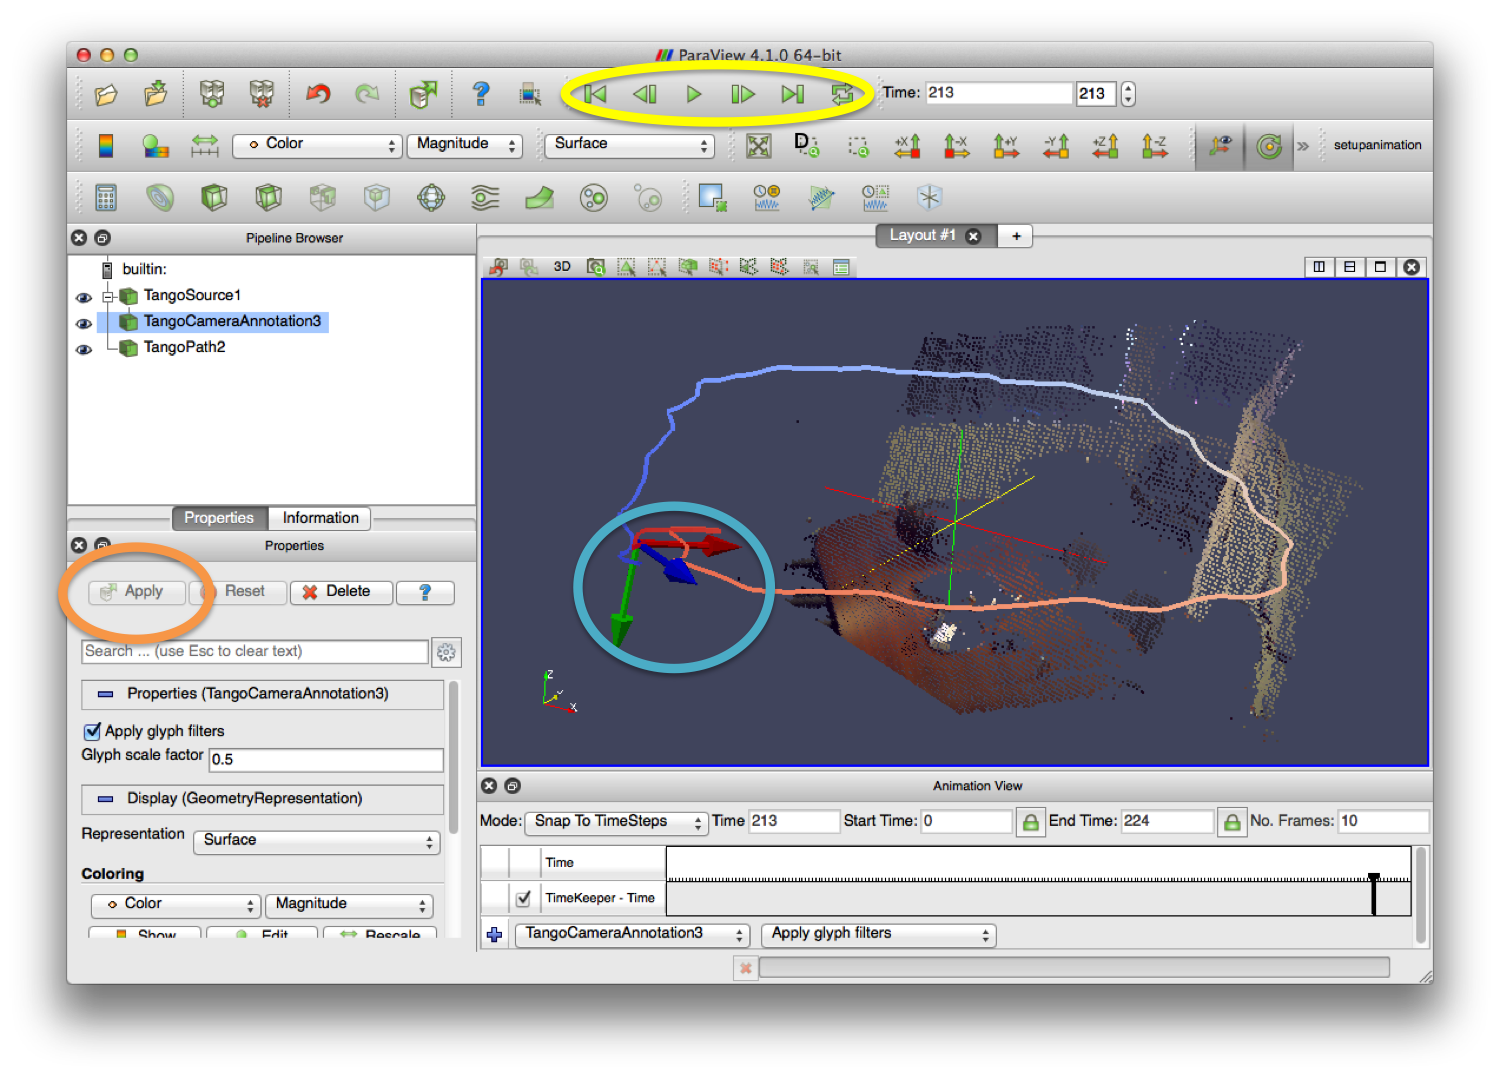
The sensor frame can also be visualized and animated through time using the Tango Camera Annotation Filter. First, click on the TangoSource filter in the Pipeline Browser to make sure it is selected; this will ensure that the new filter is added with the TangoSource as its input. Next, select Tango Camera Annotation Filter from the Filters->Alphabetical menu. The new filter will appear in the Pipeline Browser as a child of the TangoSource filter. The default settings for this filter are fine, so click Apply. Now you should see the current camera position represented as a frame. If you start animation the sensor frame will update in time with the point cloud data.
Hi,
I think this post is great. I succeed in reading in ur dataset and manipulate it with Paraview.
However I am facing a problem how to export point cloud in certain format using Tango device. Currently Tango SDK suggests using filestream to read data from memory, but how to save it into a file for Paraview to analyze?
Thx
Hi Frank,
This process does not use the Tango SDK for data UI but rather uses the saved results of the “tango mapper” application. For this to work you run the “tango mapper” application as described here and access the resulting files using adb to transfer to the desktop.
You can also reach us here http://www.kitware.com/company/contact_kitware.php
This is really a great tutorial, however, I believe these sources / filters are deprecated with the release of the Tango tablet. I have done my best to follow this tutorial with data output from the tablet, but because the tablet does not rely on superframes, the Tango source / path does not compile. Please post a follow-up for new tablet developers! I am extremely interested to learn how to map a space with Tango pose and point cloud data. Thanks!
Here is a complete Tutorial on how to set up PCL for Android for Project Tango: http://roomplan.de/getting-started-pcl-android/
Hope this may help you.
Regards roomplan.