Open Chemistry in JupyterLab
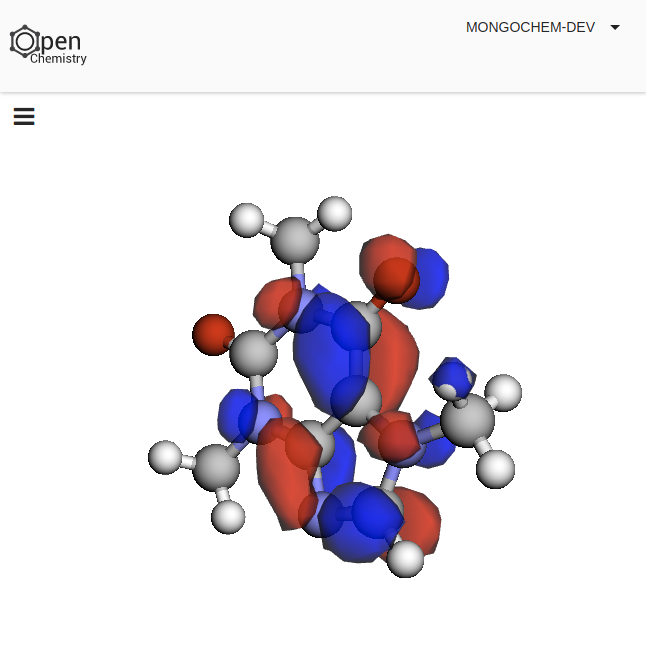
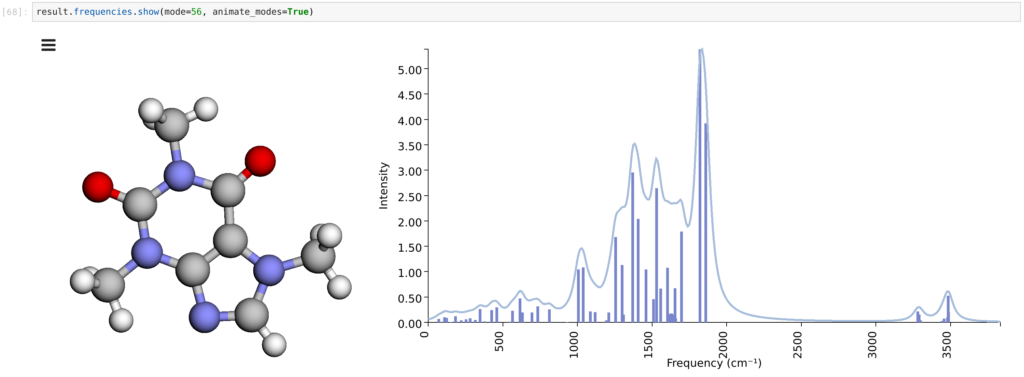
We have been working on a DoE Phase I SBIR this year as part of the Open Chemistry project, looking at the best way to combine our Girder data server project with a single-page web application and JupyterLab to offer an integrated solution for knowledge discovery in chemistry. It currently features the ability to search for chemical structures by name (using NCI/CADD’s chemical identifier resolver service), perform geometry optimizations, energy calculations, and vibrational analyses using the NWChem quantum code running on HPC resources. It also features inline visualization of the electronic structure, vibrational modes, and summarization of multiple calculations in higher level analytics.
[youtube https://www.youtube.com/watch?v=31THsQEyjYQ&w=560&h=315]
The screencast above captures some of the core functionality we have been working on, which includes triggering quantum mechanical calculations, after searching the calculation cache for existing results. This takes advantage of a Girder plugin, Cumulus, that adds integration of HPC/cloud resources for batch execution and monitoring of command-line codes. The functionality from Cumulus has been enhanced by new code that integrates with input generation for NWChem, along with indexing of calculation parameters, molecular identifiers, and search of the calculations to support the Open Chemistry notebook interface.
We recently published a research paper on the underpinnings of the Girder integration and single-page web application, and presented an early version of the JupyterLab prototype at the American Chemical Society national meeting in Washington, DC earlier this year.
The JupyterLab widgets are added using the extension API, and the core components are reused in a single-page web application for sharing data more widely. The 3D molecular visualization was developed using 3DMol.js, taking advantage of WebGL accelerated 3D rendering, isosurface calculations on the client-side, and cached cubes calculated on the server-side to support the visualization of electronic structure. This was complemented with D3-based charting, enabling the display, selection, and animation of calculated vibrational modes in the browser and JupyterLab notebook.
This work has been supported by development of JSON-based data structures, extending it to support communication of vibrational modes, volumetric data, and chemical structure to support the web-based components. Many of these structures have also been mapped to the MongoDB-based document store underpinning the Girder data server component, and the chemistry specific RESTful endpoints added in support of the work described above.
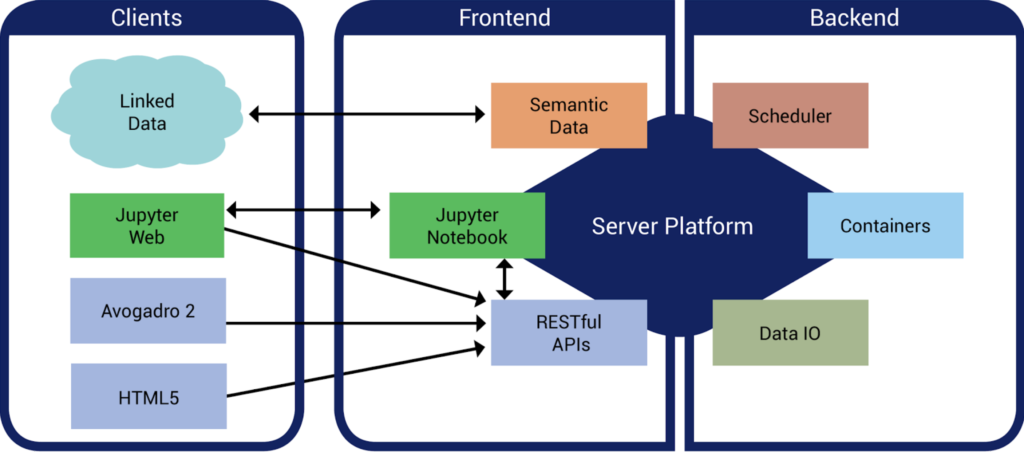
The code for the extensions has been developed here, and here, using Docker and Ansible to support deployment of a deep stack that is summarized in the architecture diagram above.
This material is based upon work supported by the U.S. Department of Energy, Office of Science, Office of Basic Energy Sciences, Small Business Innovation Research (SBIR) program under Award Number DE-SC0017193.