Vis on the Web

Kitware has been exploring web visualization for almost a decade, growing our capabilities and technologies. In that time, the need for web visualization and online data management and analysis has grown as teams have become more and more geographically diverse.
The web technologies we have developed fulfill a wide range of needs. We have built libraries and toolkits for data visualization and image processing, tools for data management and analysis, and full simulation environments. We also have example applications that demonstrate how the capabilities of these tools and applications can be easily customized for specific workflows.
Choosing a client-side vs server-side implementation
Kitware has developed technology for both client side and server side visualization, to handle differing needs for speed and processing power. This is one of the most important decisions when developing a web application for visualization – where the data processing will be done. Both client and server-side processing have their advantages and drawbacks. It is important that you carefully understand all parameters, such as the data size, the network capability, the number of concurrent users, the type of rendering, the devices on which the application will run, and the types of computation needed.
Libraries
Kitware has developed the following open source libraries for building custom web applications.
VTK.js
VTK.js is our core web visualization library, with a nearly identical API to the desktop (C++) VTK. VTK.js is a client-side, WebGL based framework for delivering 3D interactive visualization inside the browser.
VTK.js leverages the VTK method of processing data using a data flow graph (pipeline) in which each algorithm takes zero or more inputs and produces zero or more outputs. A strategic design decision focused VTK.js development primarily towards algorithms and processing related to rendering, and, therefore, it does not include some of the I/O and filtering of its C++ predecessor.
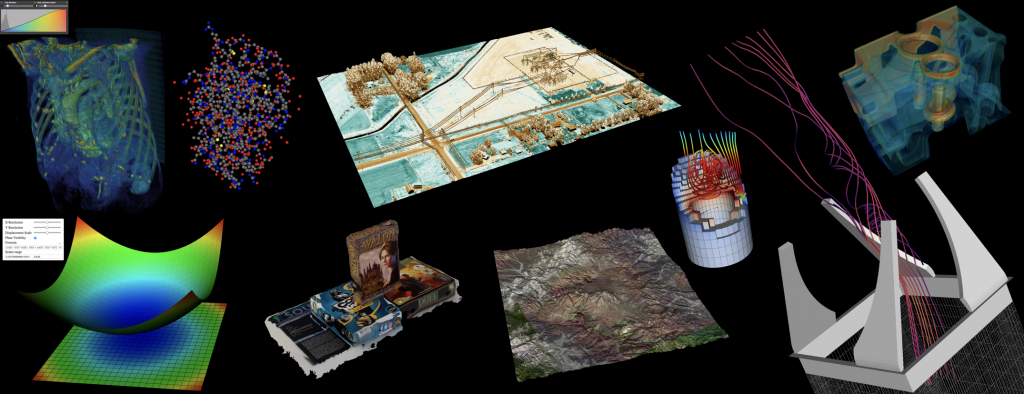
As demonstrated by our examples (https://kitware.github.io/vtk-js/examples/index.html), VTK.js allows us to define and build expressive visualization pipelines within the browser.
ITK.js
ITK.js combines Emscripten and ITK to enable high-performance image analysis in a JavaScript runtime environment.
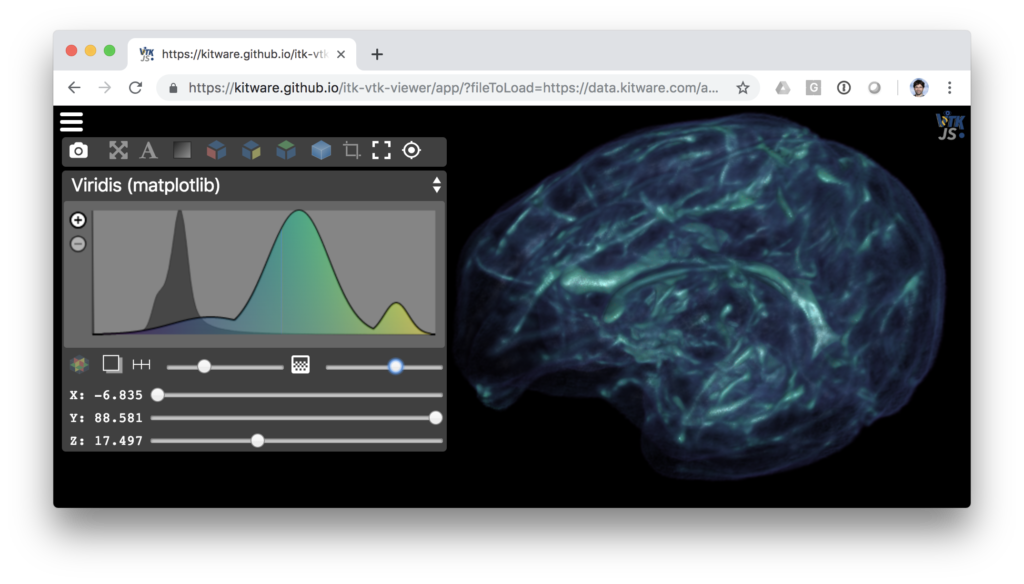
ITK.js provides tools to build cross-compiled C/C++ code to JavaScript (asm.js) and WebAssembly; bridge local filesystems, native JavaScript data structures, and traditional file formats; transfer data efficiently in and out of the Emscripten runtime; and asynchronously execute processing pipelines in a background thread.
ITK.js can be used to execute ITK, VTK or arbitrary C++ codes in the browser or within a server with Node.js. An example ITK.js application is located at https://kitware.github.io/itk-vtk-viewer/app/ and can be used to process volume data (nrrd format) or images (jpg/tiff/bmp formats).
ParaViewWeb
ParaViewWeb (http://kitware.github.io/paraviewweb) is a web framework used to build applications with interactive scientific visualization in the browser. These applications can leverage VTK and/or ParaView backends for remote data processing and rendering.
Since ParaViewWeb’s conception in 2010, when the source code was part of the ParaView repository, it has expanded both toolsets and technologies to break free from the ParaView CMake-based software processes and move to its own dedicated repository based on a modern web suite for development.
Today, ParaViewWeb is more than just a web library for remote data processing and rendering. ParaViewWeb has embraced ECMAScript 6 and developed a number of modules, graphical user interface components, and specific widgets to drive various visualizations with or without a backend server.
As demonstrated by our examples (http://kitware.github.io/paraviewweb/examples/), ParaViewWeb is a critical component in a wide variety of visualization applications within the browser.
Applications
The following set of applications demonstrate what can be done with vtk.js and ParaViewWeb. They can be used as they are, or as a base to build your own custom applications around.
ParaView Glance
ParaView Glance (https://kitware.github.io/paraview-glance/app/) is a web-based visualization application built on VTK.js. It’s both desktop- and mobile-ready. It demonstrates the power of our web capabilities and can be customized to a variety of specific applications.
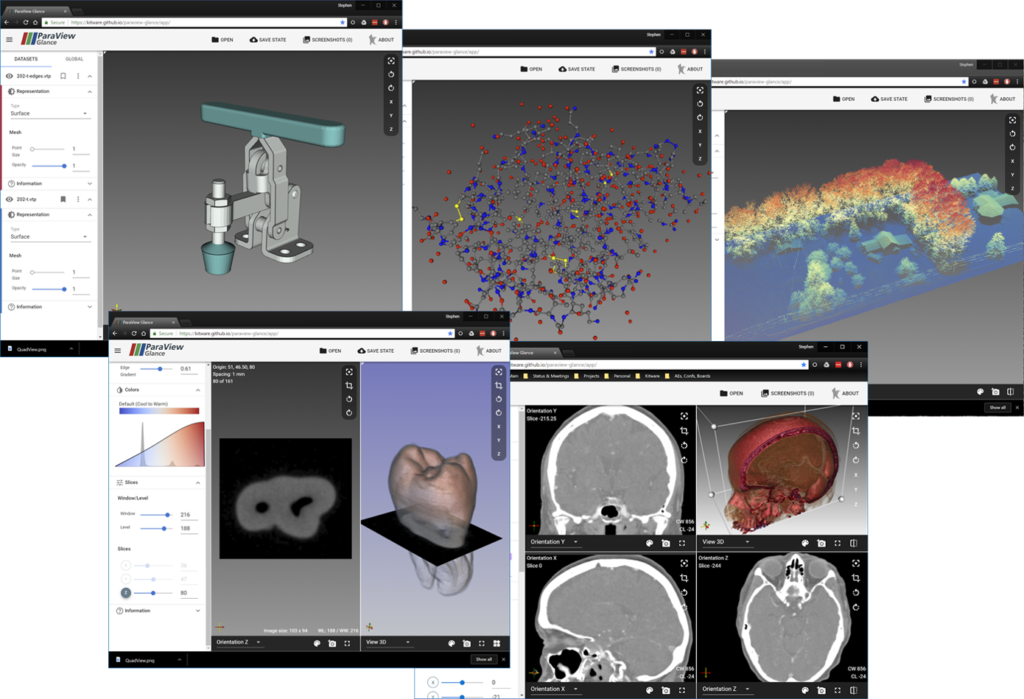
ParaView Glance is a light-weight, open-source, VTK.js based web application developed at Kitware for visualizing volumetric images, molecular structures, geometric objects, and point clouds. It is intended to allow users to quickly glance at their small to medium size data. Ultimately, ParaView Glance is intended to help end-users: quickly view your data on your computer; review items-of-interest on the Girder data management system; and develop new applications involving VTK.js and ITK.js.
ParaView Glance has been architected to be a highly customizable platform. It can be used as a basis for creating stand-alone web-based applications, desktop applications via Electron, and web-based systems that involve backend services.
ParaView Visualizer
ParaView Visualizer (https://kitware.github.io/visualizer/) provides a web user interface to ParaView in the browser. Visualizer is a core web offering, and we’ve been updating it throughout our evolving use of web technologies.
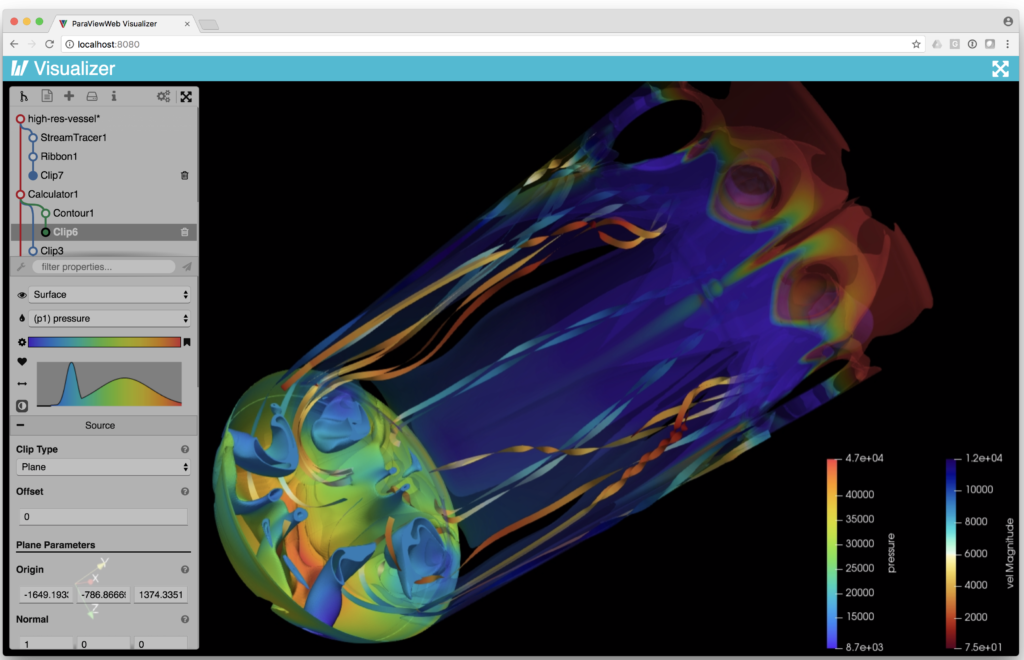
ParaView Visualizer leverages ParaView’s design with dynamic user interface (UI) generation based on Proxy definitions. Relying on ParaView’s design has both benefits and drawbacks. The benefits are that ParaView end-users are familiar with the application use and its overall organization. However, for beginners or focused end-users, the dynamic UI may not be as usable for these end-users. Another application, ParaView Lite, was created to demonstrate how the dynamic UI could be modified to simplify or customized to fit the use.
ParaView Visualizer and its dependencies are still evolving thanks to community interest and contributions.
ParaView Lite
We plan to replace ParaView Visualizer with the customizable, tailored UI available in ParaView Lite (https://kitware.github.io/paraview-lite/). While a customized experience is the goal of Lite, we intend to support the generous capabilities provided through ParaView’s dynamic UI design where no customization is defined.
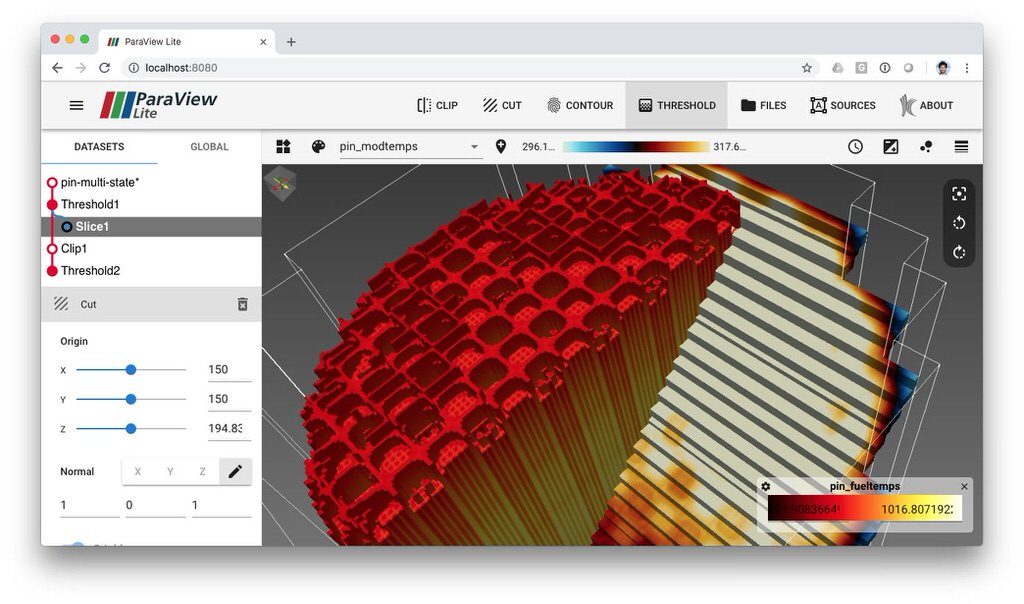
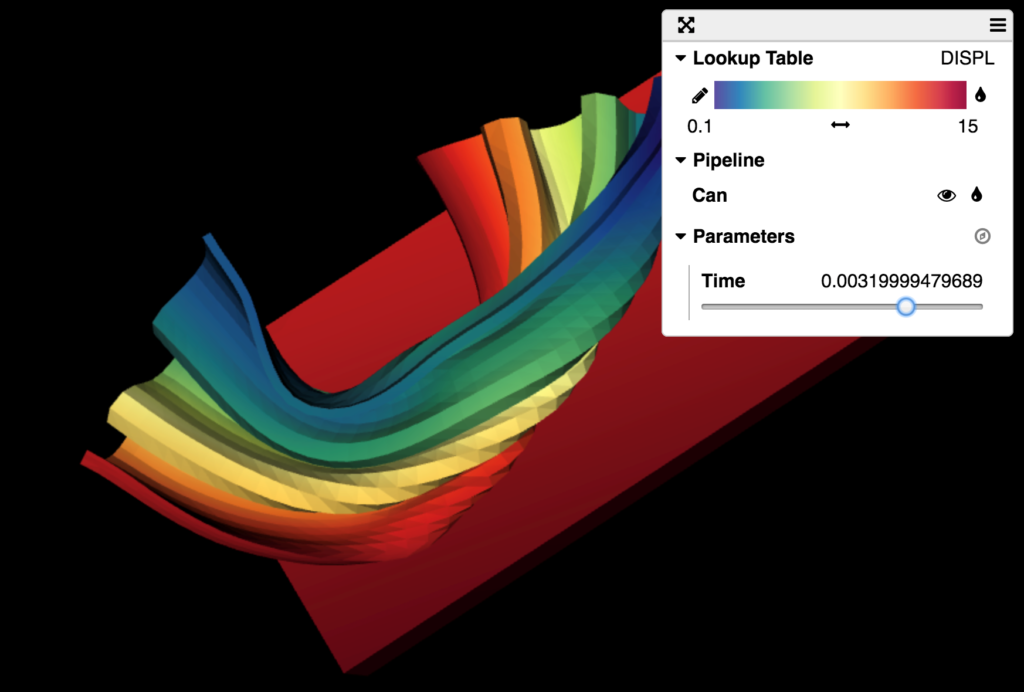
Like Visualizer, ParaView Lite is a web application that enables scientific visualization in the browser using a ParaView backend for data processing and rendering. The end-user can load, filter, map, and render remote data without the burden or cost of moving the data around.
ParaView Lite embraces a fresh web look with both light and dark modes that can be enabled by the end-user. ParaView Lite is a young project but should remain on your watch list if you are looking for an alternative to ParaView Visualizer.
Arctic Viewer
ArcticViewer (http://kitware.github.io/arctic-viewer/) is a research application to explore both image-based analysis and visualization techniques for extreme scale dataset exploration with various deployment methods ranging from standalone desktop application to mobile application utilizing the same web core. These image-based techniques are described in greater depth in the papers by Ahrens et al. [1] and O’Leary [2] et al.
The ArcticViewer scientific analysis and visualization application differs from Visualizer and ParaView Lite by not requiring a processing and rendering server like VTK or ParaView. ArcticViewer relies on pre-processed data read directly by the web client. In this use case, ParaViewWeb provides the various data handlers, UI, data access, and rendering modules to drive the application.
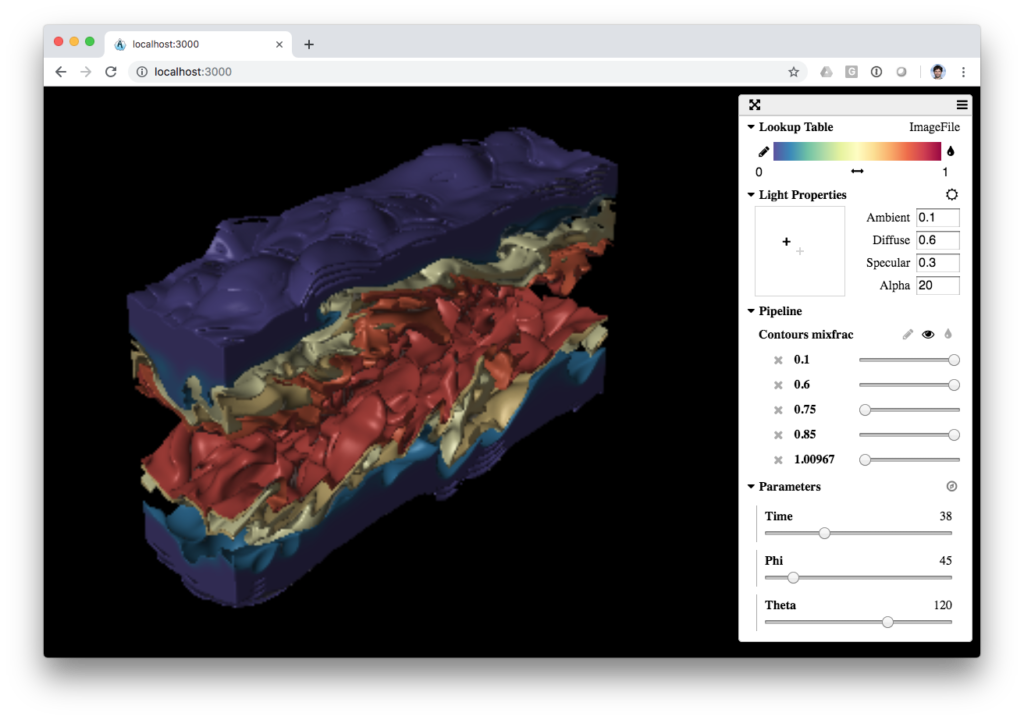
ArcticViewer implicitly understands various types of data via a JSON configuration file, and the appropriate components are instantiated based on the particular type of data. It allows the end-user to browse through data extracts that have been generated using in situ (ParaView Catalyst with the Cinema format) or batch processing to produce interactive analysis and visualization. ArcticViewer provides viewing methods for extracts including images, composite opaque and transparent visualization images, geometry, and complete 3D volumes.
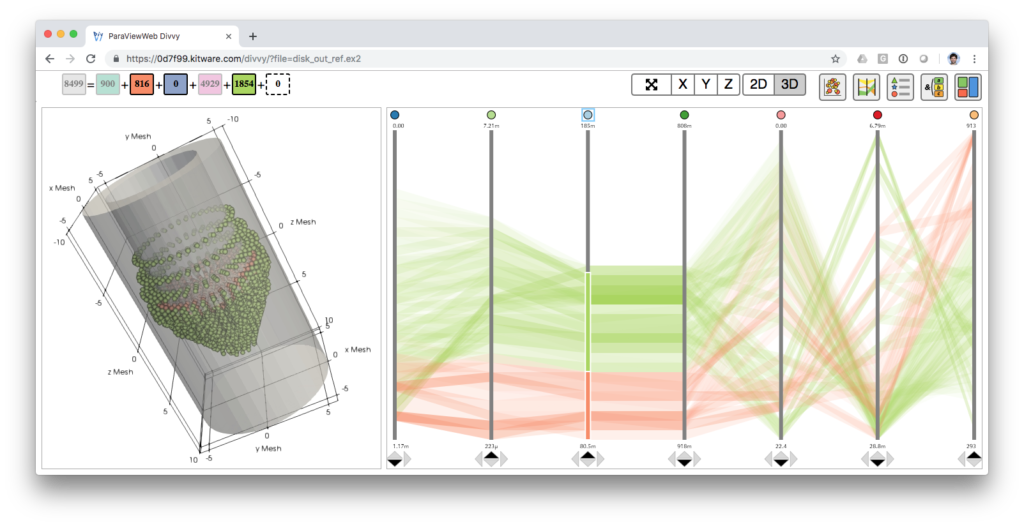
Divvy
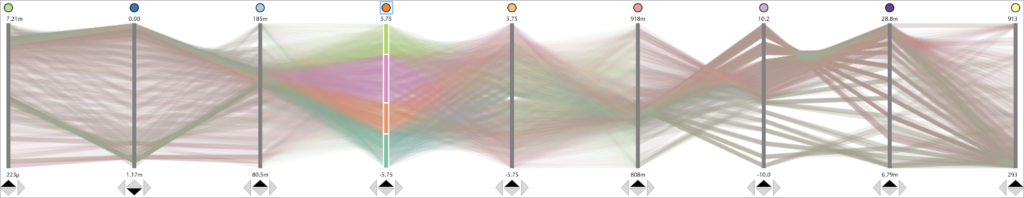
At its core, Divvy (https://kitware.github.io/divvy/) is a tool for information visualization techniques. These are typically used on data in the fields of economics and social sciences; the goal of Divvy is to extend this type of analysis to data sets for traditional scientific visualization models. Instead of visualizing a 3d representation showing real space, Divvy uses InfoVis techniques to look at and analyze the data underneath the simulation.
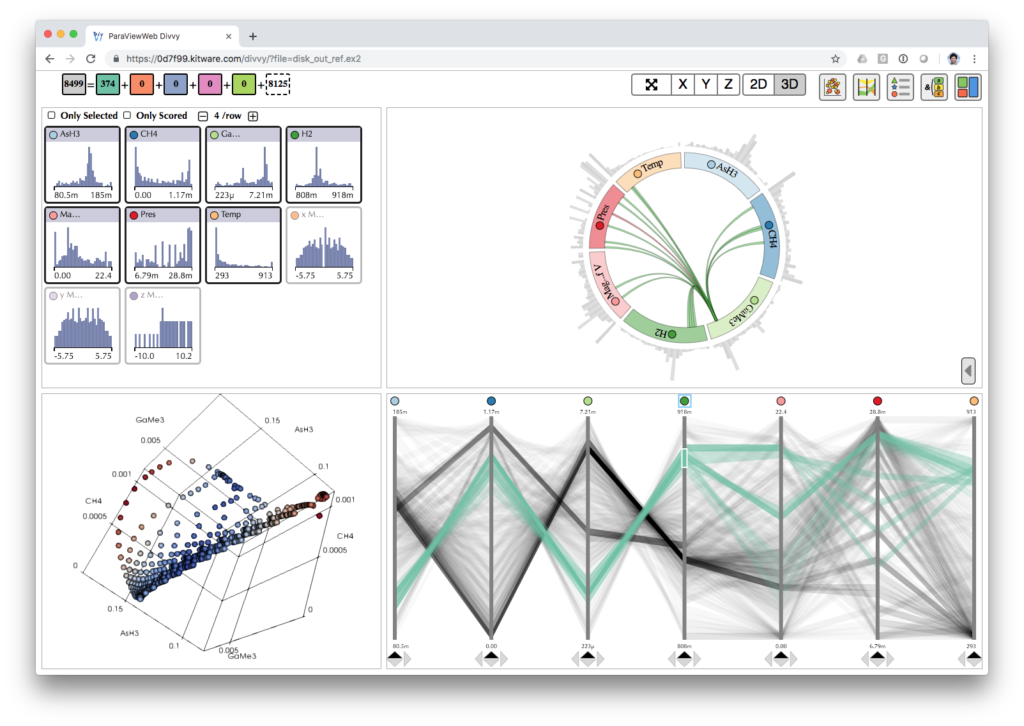
One of the strengths of Divvy is in analysis of multidimensional data. Traditional visualization is limited in how many dimensions, such as pressure, temperature, density, etc., can be shown in 3D space. Divvy makes use of readers and rendering capabilities in ParaView to create a 3D scatterplot or to visualize a mesh rendering along with selected points, while also exposing interactive charts to simultaneously analyze and explore a complete tabular list of the data.
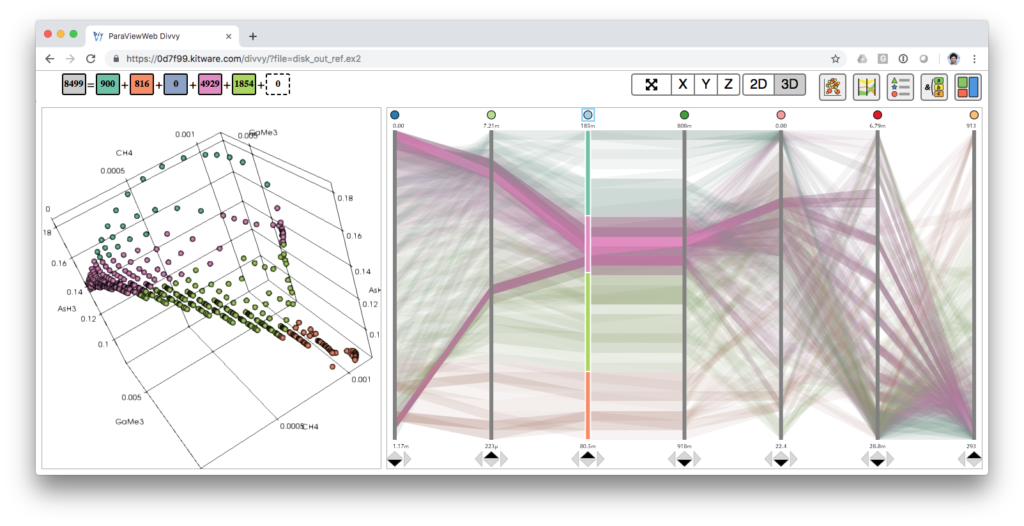
Additionally, this demonstrates some of the unique components of Kitware’s tools for web visualization; these InfoVis techniques can be added to custom web applications for a unique workflow marrying scientific and information visualization.
Data Management
Kitware also has solutions for data management and analytics that can enhance your web application. Learn more at http://resonant.kitware.com/
Kitware offers training, support, and custom development services to help build a commercially viable application based on these components, helping organizations get to market faster. For details on how Kitware can help with your next project, contact kitware@kitware.com.
References:
[1] An Image-Based Approach to Extreme Scale in Situ Visualization and Analysis
James Ahrens; Sébastien Jourdain; Patrick OLeary; John Patchett ; David H. Rogers; Mark Petersen
[2] Cinema image-based in situ analysis and visualization of MPAS-ocean simulations
Patrick O’Leary; James Ahrens; Sébastien Jourdain; Scott Wittenburg; David H. Rogers; Mark Petersen